Story Highlights
- Preference for saving versus spending continues to climb
- Pre-financial crisis age differences have disappeared
- More say they are spending less than say they are spending more
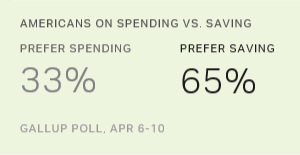
WASHINGTON, D.C. -- Nearly two in three Americans now say they enjoy saving money more than spending it, further establishing the pro-savings trend that developed in the wake of the 2008 financial crisis. With 33% now saying they prefer spending, the gap between those who prefer saving and those who prefer spending is at its widest since Gallup first asked the question in 2001.
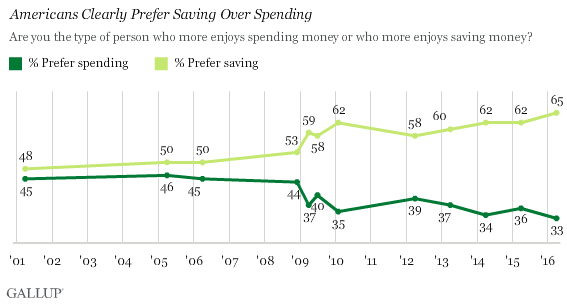
In three Gallup polls before the 2008 crisis, an average of 49% of U.S. adults said they preferred saving. The average has jumped to 60% in nine polls since then. The highest percentage yet measured (65%) is the most recent -- from the April 6-10 Gallup Economy and Personal Finance poll.
The question does not measure actual spending and saving. Instead, it gives insight into what Americans would prefer to do -- save or spend. In fact, those with the lowest incomes are generally more likely than those with the highest incomes to say they get greater enjoyment from saving.
Age Differences Disappear in Recent Years
A look at combined results for the three pre-crisis polls and the three most recent polls reveals the extent to which people in different age groups have changed their attitudes about saving and spending. Before the crisis, a slight majority of those younger than 30 favored spending; those aged 30 to 49 were split; those aged 50 to 64 slightly favored saving; and those aged 65 and older were clearly the most likely to prefer saving.
As the percentage preferring saving increased significantly in recent years, most of the movement in this direction occurred among the three younger age groups. The net result is that once-obvious differences among age groups before the crisis have now almost disappeared.
| 2001-2006% | 2014-2016% | ||||||||||||||||||||||||||||||||||||||||||||||||||||||||||||||||||||||||||||||||||||||||||||||||||
|---|---|---|---|---|---|---|---|---|---|---|---|---|---|---|---|---|---|---|---|---|---|---|---|---|---|---|---|---|---|---|---|---|---|---|---|---|---|---|---|---|---|---|---|---|---|---|---|---|---|---|---|---|---|---|---|---|---|---|---|---|---|---|---|---|---|---|---|---|---|---|---|---|---|---|---|---|---|---|---|---|---|---|---|---|---|---|---|---|---|---|---|---|---|---|---|---|---|---|---|
| 18 to 29 | |||||||||||||||||||||||||||||||||||||||||||||||||||||||||||||||||||||||||||||||||||||||||||||||||||
| Prefer spending | 54 | 33 | |||||||||||||||||||||||||||||||||||||||||||||||||||||||||||||||||||||||||||||||||||||||||||||||||
| Prefer saving | 43 | 66 | |||||||||||||||||||||||||||||||||||||||||||||||||||||||||||||||||||||||||||||||||||||||||||||||||
| 30 to 49 | |||||||||||||||||||||||||||||||||||||||||||||||||||||||||||||||||||||||||||||||||||||||||||||||||||
| Prefer spending | 50 | 38 | |||||||||||||||||||||||||||||||||||||||||||||||||||||||||||||||||||||||||||||||||||||||||||||||||
| Prefer saving | 47 | 61 | |||||||||||||||||||||||||||||||||||||||||||||||||||||||||||||||||||||||||||||||||||||||||||||||||
| 50 to 64 | |||||||||||||||||||||||||||||||||||||||||||||||||||||||||||||||||||||||||||||||||||||||||||||||||||
| Prefer spending | 43 | 34 | |||||||||||||||||||||||||||||||||||||||||||||||||||||||||||||||||||||||||||||||||||||||||||||||||
| Prefer saving | 51 | 64 | |||||||||||||||||||||||||||||||||||||||||||||||||||||||||||||||||||||||||||||||||||||||||||||||||
| 65 and older | |||||||||||||||||||||||||||||||||||||||||||||||||||||||||||||||||||||||||||||||||||||||||||||||||||
| Prefer spending | 33 | 34 | |||||||||||||||||||||||||||||||||||||||||||||||||||||||||||||||||||||||||||||||||||||||||||||||||
| Prefer saving | 58 | 62 | |||||||||||||||||||||||||||||||||||||||||||||||||||||||||||||||||||||||||||||||||||||||||||||||||
| Combined Gallup polls, 2001/2005/2006 and 2014/2015/2016 | |||||||||||||||||||||||||||||||||||||||||||||||||||||||||||||||||||||||||||||||||||||||||||||||||||
As Personal Finances Improve, So Does Appeal of Saving
The appeal of saving over spending shows some signs of being the new normal rather than a temporary reaction to the hard times after 2008. In April 2006, 51% of Americans thought their financial situation was good or excellent, but by April 2010, the percentage had dropped to 41%. During roughly the same period, with unemployment reaching as high as 10% and wages stagnant, the appeal of saving over spending grew from 50% to 62%.
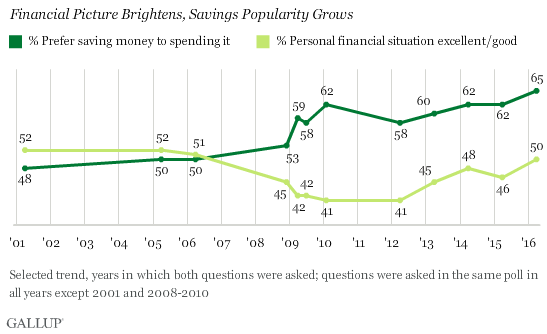
But even as the percentage of Americans considering their financial situation excellent or good has rebounded in the past few years, Americans have not moved back toward enjoying spending more. In Gallup's current poll, the 50% who say their financial situation is good or excellent is the highest since 2007, and the 33% who prefer spending is an all-time low.
Once Again, Americans More Likely to Say They Are Spending Less
The April Economy and Personal Finance survey also asks Americans directly if they have been spending more or spending less "in recent months." Each of the nine times since 2009 that Gallup has polled on the subject, Americans have been more likely to say they have been spending less in recent months than to say they have been spending more. The current poll is no exception -- 38% say they are spending less and 28% spending more, with the rest saying their spending has not changed.
The gap between "spending less" and "spending more" has narrowed considerably since the question was asked in 2009 and 2010, when the U.S. struggled to emerge from the recession and half or more of Americans reported spending less. Today's 38% who report spending less in recent months is similar to the previous two years.
The poll also shows those who are spending more tend to think this is temporary, while those who are spending less are more likely to think it will be permanent -- further supporting the conclusion that Americans are settling into a mode in which they are mentally focused on being thrifty. That has been the case in every poll since the questions were first asked in 2009. In the current poll:
- Seventeen percent of Americans say they are spending more and that the change is temporary; 11% say they are spending more and that it will become a new, normal pattern.
- Twenty-nine percent say they are spending less, and that the change will become a new, normal pattern; 9% say they are temporarily spending less.
Bottom Line
Some economists are expressing concern that Americans aren't spending enough to keep the U.S. economy growing at a healthy pace, even as savings rates remain well below historical levels.
The new reality, however, is that Americans are considerably more likely than they were in the easy-credit years preceding 2008 to perceive saving money as more enjoyable than spending it. And their actions have, at least to some extent, mirrored their attitudes. Saving rates that had dropped from the double-digit levels of the 1960s and 1970s down to an abysmal 1.9% rate in July 2005 are now consistently close to or above 5%. Even as Americans have seen their own finances improving, they have continued to value saving over spending. The question now becomes whether the apparent changes in attitude will affect savings rates more than they have to date -- and what effect this will, in turn, have on the vitally important retail sector of the U.S. economy.
Survey Methods
Results for this Gallup poll are based on telephone interviews conducted April 6-10, 2016, with a random sample of 1,015 adults, aged 18 and older, living in all 50 U.S. states and the District of Columbia. For results based on the total sample of national adults, the margin of sampling error is ±4 percentage points at the 95% confidence level.
Each sample of national adults includes a minimum quota of 60% cellphone respondents and 40% landline respondents, with additional minimum quotas by time zone within region. Landline and cellular telephone numbers are selected using random-digit-dial methods.
View survey methodology, complete question responses and trends.
Learn more about how the Gallup Poll Social Series works.