Story Highlights
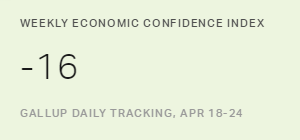
- At -16, index is down four points from the prior week
- Economic outlook component down significantly to -25
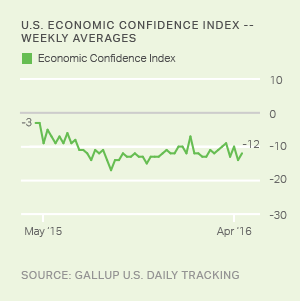
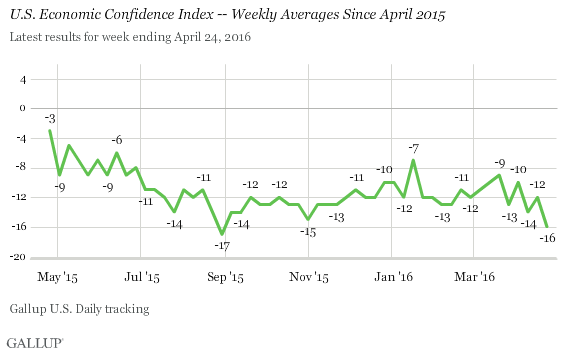
WASHINGTON, D.C. -- Americans' confidence in the U.S. economy reached its lowest weekly level so far in 2016, with Gallup's U.S. Economic Confidence Index averaging -16 for the week ending April 24. The latest figure represents a four-point drop from the previous week's average. The last time Gallup found a lower weekly score was in August 2015.
The latest figure is not markedly lower than the -11 weekly index score average recorded so far in 2016, but it is part of a decline that started in late March. Pessimism has increased despite a strong stock market in recent weeks and a persistent low unemployment rate. However, there have been reports of weak retail sales and expectations of low first quarter economic growth. Gas prices have also started to rise, although they remain well below where they were for most of the past decade. Finally, consistent statements from presidential candidates about how they would fix the U.S. economy if elected might play a part in keeping Americans' economic optimism at lower levels.
One year ago, Americans were significantly more upbeat about the economy, as the index flirted with positive territory. But recent scores are still higher than most of the low figures Gallup recorded between 2008 and the fall of 2012.
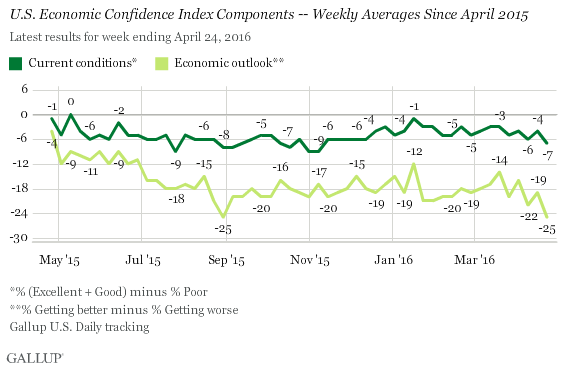
Gallup's U.S. Economic Confidence Index is the average of two components: how Americans rate current economic conditions and whether they feel the economy is improving or getting worse. The index has a theoretical maximum of +100 if all Americans say the economy is doing well and improving, and a theoretical minimum of -100 if all Americans say the economy is doing poorly and getting worse.
For the week ending April 24, the current conditions score of -7 was, by one point, the lowest so far in 2016 -- the result of 23% of U.S. adults rating the current economy as "excellent" or "good," and 30% rating it "poor." The economic outlook score showed greater change, dropping six points from the previous week to -25 -- the result of 35% of U.S. adults saying the economy is "getting better" and 60% saying it is "getting worse." This is the lowest score for this component since late August 2015, when the stock market plummeted over concerns about the Chinese economy.
These data are available in Gallup Analytics.
Survey Methods
Results for this Gallup poll are based on telephone interviews conducted April 18-24, 2016, on the Gallup U.S. Daily survey, with a random sample of 3,554 adults, aged 18 and older, living in all 50 U.S. states and the District of Columbia. For results based on the total sample of national adults, the margin of sampling error is ±2 percentage points at the 95% confidence level. All reported margins of sampling error include computed design effects for weighting.
Each sample of national adults includes a minimum quota of 60% cellphone respondents and 40% landline respondents, with additional minimum quotas by time zone within region. Landline and cellular telephone numbers are selected using random-digit-dial methods.
Learn more about how Gallup Daily tracking works.