Story Highlights
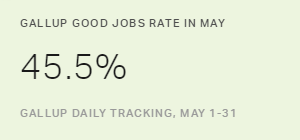
- GGJ hits 45.5%, highest for May going back to 2010
- Rate for first five months of 2016 better than in previous six years
- Unemployment, after six-year low in April, nudges upward
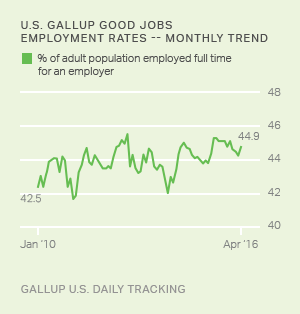
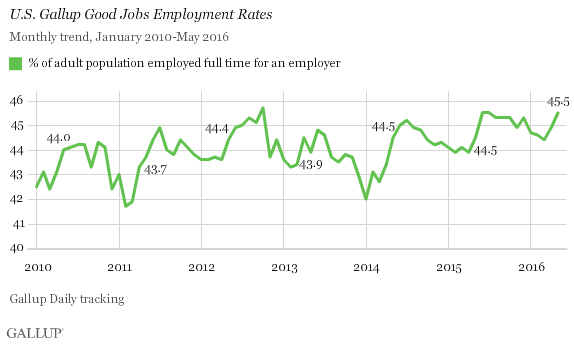
WASHINGTON, D.C. -- The Gallup Good Jobs (GGJ) rate in the U.S. was 45.5% in May, a slight increase from April's 44.9% and the highest rate for May since Gallup began measuring it in 2010.
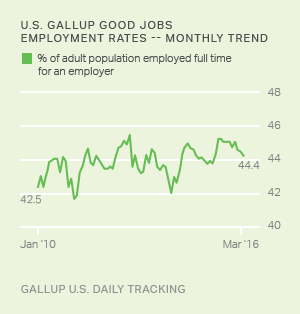
The GGJ metric tracks the percentage of U.S. adults, aged 18 and older, who work for an employer full time -- at least 30 hours per week. Gallup does not count adults who are self-employed, work fewer than 30 hours per week, are unemployed or are out of the workforce as payroll-employed in the GGJ metric.
The latest results are based on Gallup Daily tracking interviews with 31,503 U.S. adults, conducted May 1-31 by landline telephone and cellphone. GGJ is not seasonally adjusted.
The GGJ average rate for the first five months of 2016 is 44.8% -- 0.7 percentage points higher than the average for the five-month start to 2015 and more than a full point higher than the January-May averages for any of the previous five years. The growth of the monthly rate and of the rate for the year so far suggests an underlying increase in full-time work beyond the seasonal changes in employment.
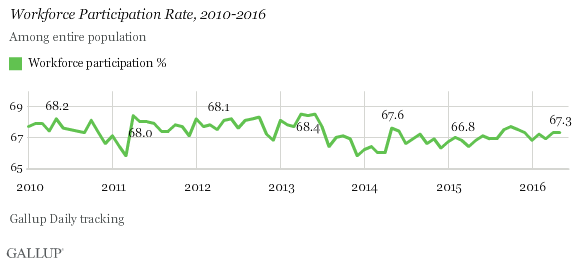
Workforce Participation at 67.3% in May
The percentage of U.S. adults in May who participated in the workforce -- by working full time, part time or not working but actively seeking and being available for work -- was 67.3%, matching the percentage for April. The average for 2016 so far is 67.1%, slightly higher than the average workforce participation of 66.9% for 2014-2015, indicating that more workers are coming into, or re-entering, the workforce than leaving.
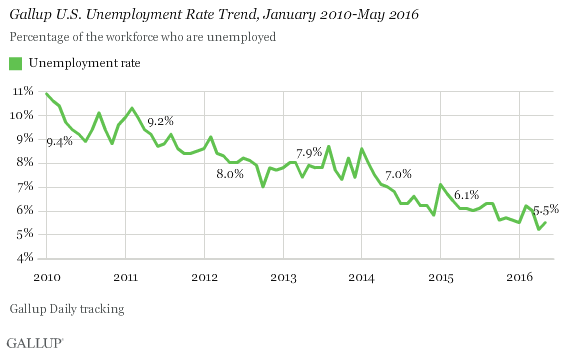
Unemployment at 5.5%
Gallup's unadjusted U.S. unemployment rate, which reached a new six-year low of 5.2% in April, rose slightly to 5.5% in May. Even with the bump, it is the first time since Gallup began tracking the unadjusted unemployment rate in 2010 that it has been below 6.0% in May. Gallup's U.S. unemployment rate represents the percentage of adults in the workforce who did not have any paid work in the past seven days, either for an employer or for themselves, and who were actively looking for and available to work.
Unlike Gallup's GGJ rate, which is a percentage of the total population, the unemployment rates that Gallup and the U.S. Bureau of Labor Statistics report are percentages of the labor force. While both Gallup and BLS data are based on surveys with large sample sizes, the two have important methodological differences -- outlined at the end of this article. Additionally, the most-discussed unemployment rate released by the BLS each month is seasonally adjusted, while Gallup reports unadjusted numbers. Although Gallup's unemployment numbers strongly correlate with BLS rates, BLS and Gallup estimates of unemployment do not always track precisely on a monthly basis.
Underemployment Stays Down
Gallup's monthly underemployment rate was 13.7% in May. This is the lowest underemployment rate in the six-plus years Gallup has been measuring it, though only 0.1 percentage point lower than in April. Gallup's U.S. underemployment rate combines the percentage of adults in the workforce who are unemployed (5.5%) with those who are working part time but desire full-time work (8.2%).

Bottom Line
In every month so far this year, the GGJ rate has been the highest for that month since Gallup started measuring it in 2010. Almost halfway through the year, employment in the U.S. is on an upward trajectory that goes beyond any seasonal fluctuations. Gallup's Job Creation Index, which measures worker perceptions of hiring activity at their place of employment, is also at the high point in its eight-year trend.
Historically, the June GGJ rate has shown an increase from May of the same year. As such, there is reason to believe the GGJ will continue to climb -- at least nominally -- in the coming month.
While the unemployment rate took a slight turn upward for the month, it was still tied for the second-lowest point in Gallup's tracking history of the rate. Meanwhile, underemployment and workforce participation -- two measures that help fill out the employment picture -- both continued to provide positive news.
The data in this article are available in Gallup Analytics.
| Most recent month (May 2016) | Previous month (April 2016) | Month a year ago (May 2015) | |||||||||||||||||||||||||||||||||||||||||||||||||||||||||||||||||||||||||||||||||||||||||||||||||
|---|---|---|---|---|---|---|---|---|---|---|---|---|---|---|---|---|---|---|---|---|---|---|---|---|---|---|---|---|---|---|---|---|---|---|---|---|---|---|---|---|---|---|---|---|---|---|---|---|---|---|---|---|---|---|---|---|---|---|---|---|---|---|---|---|---|---|---|---|---|---|---|---|---|---|---|---|---|---|---|---|---|---|---|---|---|---|---|---|---|---|---|---|---|---|---|---|---|---|---|
| Employed full time, employer (GGJ)* | 45.5% | 44.9% | 44.5% | ||||||||||||||||||||||||||||||||||||||||||||||||||||||||||||||||||||||||||||||||||||||||||||||||
| Employed full time, self* | 5.7% | 5.9% | 5.4% | ||||||||||||||||||||||||||||||||||||||||||||||||||||||||||||||||||||||||||||||||||||||||||||||||
| Workforce participation rate* | 67.3% | 67.3% | 66.8% | ||||||||||||||||||||||||||||||||||||||||||||||||||||||||||||||||||||||||||||||||||||||||||||||||
| Unemployment rate** | 5.5% | 5.2% | 6.1% | ||||||||||||||||||||||||||||||||||||||||||||||||||||||||||||||||||||||||||||||||||||||||||||||||
| Employed part time, wanting full time** | 8.2% | 8.6% | 8.5% | ||||||||||||||||||||||||||||||||||||||||||||||||||||||||||||||||||||||||||||||||||||||||||||||||
| Underemployment rate** | 13.7% | 13.8% | 14.7% | ||||||||||||||||||||||||||||||||||||||||||||||||||||||||||||||||||||||||||||||||||||||||||||||||
| *Metrics represent percentages of the U.S. population aged 18 or older who have a job or are actively seeking work. | |||||||||||||||||||||||||||||||||||||||||||||||||||||||||||||||||||||||||||||||||||||||||||||||||||
| **Metrics represent percentages of the U.S. workforce. | |||||||||||||||||||||||||||||||||||||||||||||||||||||||||||||||||||||||||||||||||||||||||||||||||||
| GALLUP | U.S. Bureau of Labor Statistics | |
|---|---|---|
| Population | 18 and older | 16 and older |
| Adjustments | Not seasonally adjusted | Seasonally adjusted |
| Sample size | 30,000 individuals per month | 60,000 households per month |
| Mode of interview | RDD telephone, including cellphones | Rotating panel with face-to-face and telephone interviewing |
| Data collection period | Continuous | One-week reference period during mid-month |
| Reporting frequency | Daily, weekly and monthly, based on 30-day rolling averages | Monthly, based on one-week reference period |
Survey Methods
Results for this Gallup poll are based on telephone interviews conducted May 1-31, 2016, on the Gallup U.S. Daily survey, with a random sample of 31,503 adults, aged 18 and older, living in all 50 U.S. states and the District of Columbia. For results based on the total sample of national adults, the margin of sampling error is ±1 percentage point at the 95% confidence level. All reported margins of sampling error include computed design effects for weighting.
Each sample of national adults includes a minimum quota of 60% cellphone respondents and 40% landline respondents, with additional minimum quotas by time zone within region. Landline and cellular telephone numbers are selected using random-digit-dial methods.
Learn more about how the Gallup U.S. Daily works.