Story Highlights
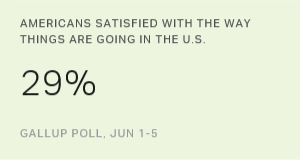
- Satisfaction at 29% in June, low by historical standards
- Democrats' satisfaction up in June, Republicans' down slightly
- Obama's term in office marked by generally low satisfaction levels
PRINCETON, N.J. -- Nearly three in 10 Americans (29%) are satisfied with the way things are going in the U.S., continuing the trend of low satisfaction levels since 2007. Americans' satisfaction has averaged 24% across the 89 months of the Obama administration to date, well below the average 37% satisfaction level since Gallup began measuring it in 1979.
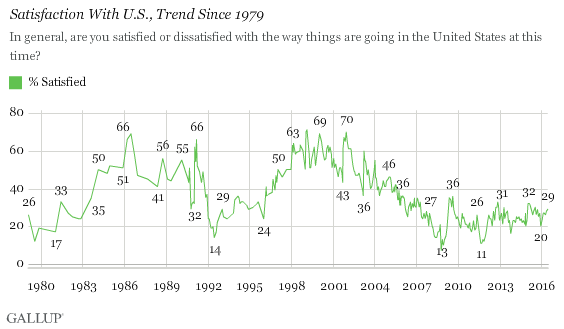
June's 29% satisfaction reading is, by one percentage point, the highest of 2016 so far, although the 27% satisfaction for the year to date is about on par with the 28% average in 2015 and the 27% in 2009. All of these recent yearly averages are low on an absolute basis, with a clear majority of Americans in each year since 2002 saying they are dissatisfied with the way things are going in the nation.
Recent satisfaction levels are particularly low compared with the high levels of satisfaction measured in the mid-1980s, in 1991 after the first Gulf War, in the late 1990s and after 9/11. In addition to the past eight years, Americans were also sour on the situation of the U.S. during challenging economic times in 1979 and the early 1980s, and between 1992 and 1995.
Democrats' Satisfaction Jumps in June
As is always the case, satisfaction differs sharply by party identification, with Republicans' current 10% satisfaction versus Democrats' 51% reflecting how each relates to the party occupying the White House. Americans who identify with the president's party are much more positive about the nation's course.
Democrats' current satisfaction level is sharply higher than it has been in previous months, and much higher than the Democratic average of 39% since President Barack Obama took office in 2009. Democrats' satisfaction rose dramatically when Obama first took office, and Democrats have been more positive than independents or Republicans since, although satisfaction has varied.
Democrats' satisfaction was also high just after Obama's initial election, after his re-election in 2012 and in early 2015. Democrats were dissatisfied with the way things were going in the U.S. in 2011 when the stock market plummeted.
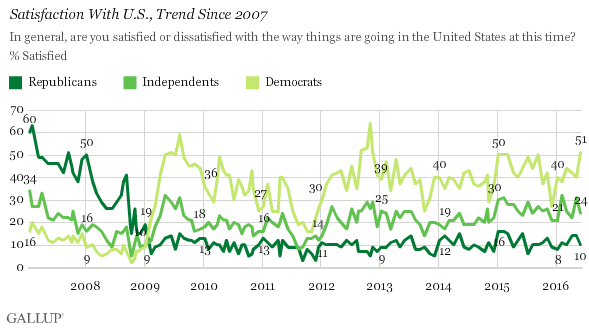
While Democrats' satisfaction rose in June, Republicans' and independents' satisfaction slipped. This kept the overall increase in satisfaction to just one point between May and June. Since Obama took office, Republicans' satisfaction levels have averaged 10% and have not strayed far from that mark on a month-to-month basis -- including the current 10% reading in June. Republicans were much more likely to be satisfied when President George W. Bush was in office, with an average 47% satisfaction level in 2007 and 28% in 2008 -- even with a sharp drop in satisfaction later that year.
Average 24% Satisfaction Since Obama Took Office
The low satisfaction levels in recent years mean that Obama will be leaving office with an overall satisfaction average -- 24% for the 89 months of his presidency so far -- that is lower than the average measured across the term of any president since Jimmy Carter. Gallup has only three measures during the Carter administration, all in 1979, and they average 19%. Obama's average to date is also below the 37% overall average since Gallup began measuring it in 1979.
Implications for the Election Are Unclear
It is not totally clear what Americans' perceived satisfaction so far this year will mean for the presidential election. Much can happen between now and November, although history shows that the satisfaction readings in the first six months of the year are highly related to where satisfaction ends up for the year overall.
In 1992, the nation's dissatisfaction with the way things were going -- underscored by the low job approval rating of incumbent President George H.W. Bush -- was related to Bush's loss to challenger Bill Clinton. Similar circumstances pertained in the open-seat election in 2008, with low satisfaction and low presidential job approval ratings, and with the incumbent party also losing the White House.
In the open-seat election of 2000, satisfaction was high, and the incumbent Democratic president had high job approval ratings. However, the Democrats lost the White House to the Republicans (although the Democratic candidate, Al Gore, had a narrow popular vote margin over the Republican, George W. Bush). Satisfaction was almost twice as high in the first half of 2004 as in the first half of 2012, but the incumbent was re-elected in both instances. The momentum in satisfaction was different in both years. In 2004, satisfaction was lower than when Bush took office -- and in particular after 9/11 -- while in 2012, satisfaction was higher than when Obama first took office.
Historical data are available in Gallup Analytics.
Survey Methods
Results for this Gallup poll are based on telephone interviews conducted June 1-5, 2016, with a random sample of 1,027 adults, aged 18 and older, living in all 50 U.S. states and the District of Columbia. For results based on this sample of national adults, the margin of sampling error is ±4 percentage points at the 95% confidence level. For results based on the sample of 308 Republicans, the margin of sampling error is ±6 percentage points at the 95% confidence level. For results based on the sample of 386 independents, the margin of sampling error is ±6 percentage points at the 95% confidence level. For results based on the sample of 313 Democrats, the margin of sampling error is ±6 percentage points at the 95% confidence level. All reported margins of sampling error include computed design effects for weighting.
Each sample of national adults includes a minimum quota of 60% cellphone respondents and 40% landline respondents, with additional minimum quotas by time zone within region. Landline and cellular telephone numbers are selected using random-digit-dial methods.
Learn more about how the Gallup Poll Social Series works.