Story Highlights
- Index score unchanged for a third consecutive week
- Economic outlook component reached 10-week high
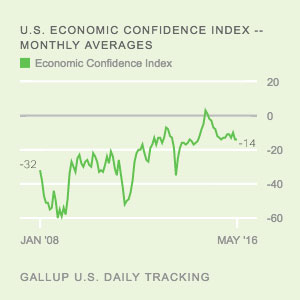
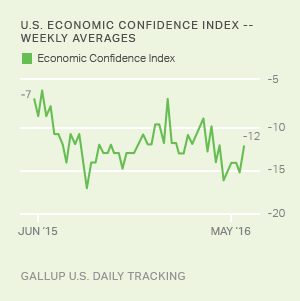
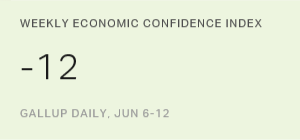
WASHINGTON, D.C. -- Americans' confidence in the U.S. economy is holding steady, with the public evaluating the economy slightly negatively. Gallup's U.S. Economic Confidence Index averaged -12 for the week ending June 12 -- the third week in a row that it has maintained this score -- after slightly lower readings in late April through mid-May.
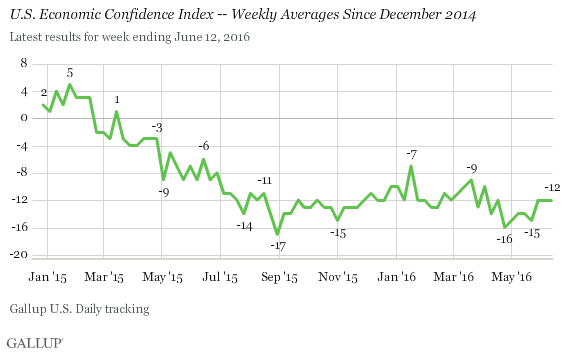
Index scores so far in 2016 have not been as high as their comparable readings in 2015, which yielded rare positive scores in the first few months of the year. From a broader perspective, Americans' level of confidence in the national economy is up significantly from where it was after the Great Recession.
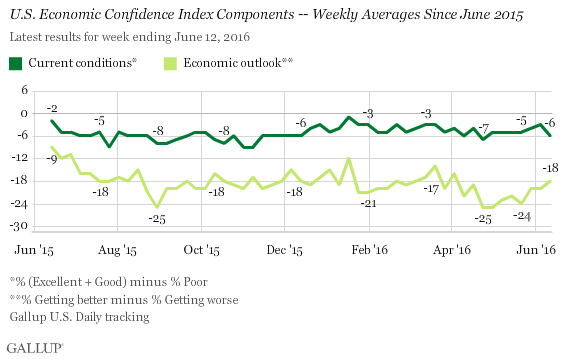
Gallup's U.S. Economic Confidence Index is the average of two components: how Americans rate current economic conditions and whether they feel the economy is improving or getting worse. The index has a theoretical maximum of +100 if all Americans say the economy is doing well and improving, and a theoretical minimum of -100 if all Americans say the economy is doing poorly and getting worse.
For the week ending June 12, the current conditions score registered -6, consistent with the range of -1 to -9 readings on this component over the past year. This latest score is the result of 25% of U.S. adults rating the current economy as "excellent" or "good," and 31% rating it as "poor."
The latest economic outlook score of -18 showed continued improvement from readings in April and May and fell more in line with earlier scores over the past year. The current score is the result of 39% of U.S. adults saying the economy is "getting better" and 57% saying it is "getting worse."
These data are available in Gallup Analytics.
Survey Methods
Results for this Gallup poll are based on telephone interviews conducted June 6-12, 2016, on the Gallup U.S. Daily survey, with a random sample of 3,525 adults, aged 18 and older, living in all 50 U.S. states and the District of Columbia. For results based on the total sample of national adults, the margin of sampling error is ±2 percentage points at the 95% confidence level. All reported margins of sampling error include computed design effects for weighting.
Each sample of national adults includes a minimum quota of 60% cellphone respondents and 40% landline respondents, with additional minimum quotas by time zone within region. Landline and cellular telephone numbers are selected using random-digit-dial methods.
Learn more about how Gallup Daily tracking works.