Story Highlights
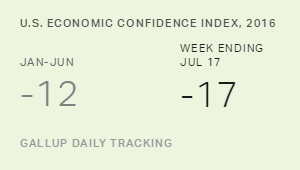
- Gallup's U.S. Economic Confidence Index was -17 last week
- Americans' economic outlook down slightly since mid-June
- Views of current conditions stable
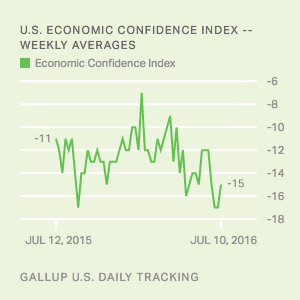
WASHINGTON, D.C. -- Americans' confidence in the economy remains weak, with Gallup's U.S. Economic Confidence Index at -17 last week, consistent with levels seen since mid-June. This is in contrast to the stronger confidence levels seen for most of the first half of the year, when the index averaged -12.
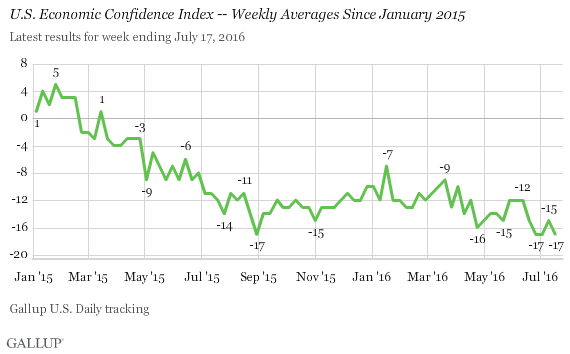
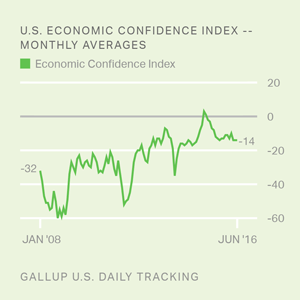
During the slow recovery from the worst recession since the Great Depression, Americans' assessments of the economy became slightly more positive than negative from late December 2014 to mid-February 2015. However, those positive sentiments faded throughout the spring and summer of 2015. Confidence slowly inched up in late 2015 and early 2016 as gas prices plummeted nationally, but confidence dipped in mid-April and again in mid-June.
U.S. economic confidence in the second half of 2016 is off to a slow start, with each weekly index score so far in July below the first-quarter and second-quarter averages of -11 and -14, respectively.
Gallup's U.S. Economic Confidence Index is the average of two components: how Americans rate current economic conditions and whether they feel the economy is improving or getting worse. The index has a theoretical maximum of +100 if all Americans were to say the economy is doing well and improving, and a theoretical minimum of -100 if all Americans were to say the economy is doing poorly and getting worse.
The current conditions score was -7 last week, similar to numbers since mid-April. This reflects 24% saying current economic conditions are excellent or good and 31% saying they are poor.
The economic outlook score averaged -27 last week, similar to figures since late June but slightly lower than scores before mid-June. This reflects 34% of Americans saying the economy is getting better and 61% saying it is getting worse.
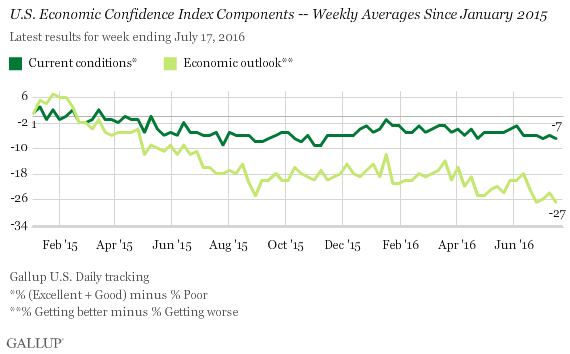
The overall decline in Gallup's U.S. Economic Confidence Index since early 2015 is almost entirely attributable to Americans' worsening economic outlook. Perceptions of current conditions have been sturdier. Americans' economic outlook has trailed their views of current conditions since March 2015.
Implications
The reasons for lower public confidence in the economy since mid-June compared with the beginning of the year are unclear. Economic confidence initially fell the week ending June 19, before the Brexit decision on June 23. Concerns about national security and its effect on the U.S. economy in the wake of international terrorism also do not appear to explain the dip. For instance, confidence remained level after the attack in Nice, France, last Thursday, averaging -18 for Monday through Thursday and -17 for Friday through Sunday.
Notably, several positive economic signs have not boosted confidence. National gas prices remain low; U.S. stock prices hit record highs last week; consumer spending is sturdy; and job creation, as reported by the U.S. Bureau of Labor Statistics, picked up in June after a disappointing May.
One possibility is that the U.S. presidential election is creating uncertainty about the future of the economy. Another possible explanation is that Americans need to see more evidence of GDP growth, wage growth and sustained improvement in the job market before their confidence in the economy will show signs of life.
These data are available in Gallup Analytics.
Survey Methods
Results for this Gallup poll are based on telephone interviews conducted July 11-17, 2016, on Gallup Daily tracking, with a random sample of 3,029 adults, aged 18 and older, living in all 50 U.S. states and the District of Columbia. For results based on the total sample of national adults, the margin of sampling error is ±2 percentage points at the 95% confidence level.
Each sample of national adults includes a minimum quota of 60% cellphone respondents and 40% landline respondents, with additional minimum quotas by time zone within region. Landline and cellular telephone numbers are selected using random-digit-dial methods.
Learn more about how the Gallup U.S. Daily works.