Story Highlights
- Her favorability is twice as high among foreign-born Hispanics
- 72% of foreign-born Hispanics say they are not registered to vote
- Hispanics less likely to be registered than blacks, whites
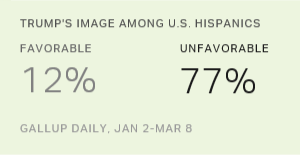
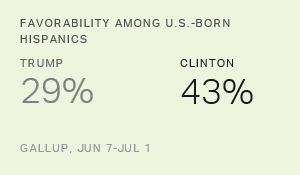
WASHINGTON, D.C. -- Though U.S. Hispanics overall view Hillary Clinton three times more favorably than they do Donald Trump (65% to 21%), her edge is significantly smaller among U.S.-born Hispanics (43% to 29%). Meanwhile, foreign-born Hispanics are almost seven times more likely to view Clinton (87%) than Trump (13%) favorably.
| Hillary Clinton | Donald Trump | ||||||||||||||||||||||||||||||||||||||||||||||||||||||||||||||||||||||||||||||||||||||||||||||||||
|---|---|---|---|---|---|---|---|---|---|---|---|---|---|---|---|---|---|---|---|---|---|---|---|---|---|---|---|---|---|---|---|---|---|---|---|---|---|---|---|---|---|---|---|---|---|---|---|---|---|---|---|---|---|---|---|---|---|---|---|---|---|---|---|---|---|---|---|---|---|---|---|---|---|---|---|---|---|---|---|---|---|---|---|---|---|---|---|---|---|---|---|---|---|---|---|---|---|---|---|
| % | % | ||||||||||||||||||||||||||||||||||||||||||||||||||||||||||||||||||||||||||||||||||||||||||||||||||
| All U.S. Hispanics | 65 | 21 | |||||||||||||||||||||||||||||||||||||||||||||||||||||||||||||||||||||||||||||||||||||||||||||||||
| U.S.-born Hispanics | 43 | 29 | |||||||||||||||||||||||||||||||||||||||||||||||||||||||||||||||||||||||||||||||||||||||||||||||||
| Hispanics born in another country | 87 | 13 | |||||||||||||||||||||||||||||||||||||||||||||||||||||||||||||||||||||||||||||||||||||||||||||||||
| Gallup, June 7-July 1, 2016 | |||||||||||||||||||||||||||||||||||||||||||||||||||||||||||||||||||||||||||||||||||||||||||||||||||
These data come from Gallup's annual Minority Rights and Relations poll, conducted June 7-July 1.
Notably, U.S.-born Hispanics' views of the candidates are similar to those of the larger population of national adults. Forty-three percent of U.S.-born Hispanics and 44% of national adults view Clinton favorably. Twenty-nine percent of U.S.-born Hispanics view Trump favorably, while his favorability is 34% among national adults.
Therefore, Clinton owes a lot of her overall image advantage among Hispanics to those born outside the U.S.
Clinton is working to transform her higher favorability among Hispanics into solid electoral support. And while Hispanics' Democratic voting history makes it more likely they will vote for Clinton than for Trump, more uncertain is how many Hispanics will turn out to support her.
Fifty-eight percent of Hispanics say they are registered to vote, far less than the 95% of non-Hispanic whites and 87% of non-Hispanic blacks who say the same. But the lower rate of reported Hispanic voter registration is almost entirely attributable to low registration among foreign-born Hispanics. Just 28% of Hispanics born outside the U.S. -- the group that views Clinton so positively -- say they are registered to vote, compared with 87% of those born in the U.S.
This lower voter registration rate could be related partly to citizenship issues, as some foreign-born Hispanics may not be legal U.S. citizens, and therefore are ineligible to vote.
| Registered to vote | Not registered to vote | ||||||||||||||||||||||||||||||||||||||||||||||||||||||||||||||||||||||||||||||||||||||||||||||||||
|---|---|---|---|---|---|---|---|---|---|---|---|---|---|---|---|---|---|---|---|---|---|---|---|---|---|---|---|---|---|---|---|---|---|---|---|---|---|---|---|---|---|---|---|---|---|---|---|---|---|---|---|---|---|---|---|---|---|---|---|---|---|---|---|---|---|---|---|---|---|---|---|---|---|---|---|---|---|---|---|---|---|---|---|---|---|---|---|---|---|---|---|---|---|---|---|---|---|---|---|
| % | % | ||||||||||||||||||||||||||||||||||||||||||||||||||||||||||||||||||||||||||||||||||||||||||||||||||
| All U.S. Hispanics | 58 | 42 | |||||||||||||||||||||||||||||||||||||||||||||||||||||||||||||||||||||||||||||||||||||||||||||||||
| U.S.-born Hispanics | 87 | 13 | |||||||||||||||||||||||||||||||||||||||||||||||||||||||||||||||||||||||||||||||||||||||||||||||||
| Hispanics born in another country | 28 | 72 | |||||||||||||||||||||||||||||||||||||||||||||||||||||||||||||||||||||||||||||||||||||||||||||||||
| Gallup, June 7-July 1, 2016 | |||||||||||||||||||||||||||||||||||||||||||||||||||||||||||||||||||||||||||||||||||||||||||||||||||
Less Than Half of Nonregistered Hispanics Plan to Register
Trump's rhetoric on immigration has hardly won him supporters among U.S. Hispanics, particularly those who were born outside the U.S. Some have speculated that Hispanics may become much more involved in the political process this year in an effort to defeat Trump. To some degree, the Gallup data already reflect an increase in Hispanic registration, with self-reported registration now up to 58%, compared with 51% in 2013.
Gallup also asked nonregistered voters whether they intend to register. Among Hispanics, about four in 10 of those not registered -- equivalent to 17% of all U.S. Hispanics -- say they are very or somewhat likely to register to vote before the presidential election this year. Theoretically, that could boost voter registration among Hispanics to 75%, but it's unclear how many Hispanics will actually follow through on their intention to register to vote.
An additional 8% of U.S.-born Hispanics say they are very or somewhat likely to register to vote, which could result in a total of 95% of registered voters among this group -- on par with the rate of U.S.-born whites.
Meanwhile, nearly half of foreign-born U.S. Hispanics (45%) have resigned themselves to not being likely to register to vote. However, the foreign-born group overall -- 27% of whom are registered to vote -- could theoretically double its voting size to a slim majority, as an additional 27% of foreign-born Hispanics report being very or somewhat likely to register before Election Day.
| Registered | Very/Somewhat likely to register | Not too/Not at all likely to register | |||||||||||||||||||||||||||||||||||||||||||||||||||||||||||||||||||||||||||||||||||||||||||||||||
|---|---|---|---|---|---|---|---|---|---|---|---|---|---|---|---|---|---|---|---|---|---|---|---|---|---|---|---|---|---|---|---|---|---|---|---|---|---|---|---|---|---|---|---|---|---|---|---|---|---|---|---|---|---|---|---|---|---|---|---|---|---|---|---|---|---|---|---|---|---|---|---|---|---|---|---|---|---|---|---|---|---|---|---|---|---|---|---|---|---|---|---|---|---|---|---|---|---|---|---|
| % | % | % | |||||||||||||||||||||||||||||||||||||||||||||||||||||||||||||||||||||||||||||||||||||||||||||||||
| All U.S. Hispanics | 58 | 17 | 25 | ||||||||||||||||||||||||||||||||||||||||||||||||||||||||||||||||||||||||||||||||||||||||||||||||
| U.S.-born Hispanics | 87 | 8 | 5 | ||||||||||||||||||||||||||||||||||||||||||||||||||||||||||||||||||||||||||||||||||||||||||||||||
| Hispanics born in another country | 28 | 27 | 45 | ||||||||||||||||||||||||||||||||||||||||||||||||||||||||||||||||||||||||||||||||||||||||||||||||
| Gallup, June 7-July 1, 2016 | |||||||||||||||||||||||||||||||||||||||||||||||||||||||||||||||||||||||||||||||||||||||||||||||||||
Bottom Line
With a population of 55 million, about one in six Americans are Hispanic, according to the U.S. Census Bureau. Though the minimum percentage of Hispanic support a candidate must garner in a national election is debatable, it is not a constituency a candidate can afford to ignore.
Trump's comments and campaign positions have offended many Hispanics, but his image has suffered less among those who were born in the U.S. While he is certainly not popular among U.S.-born Hispanics, the group hardly holds warm feelings about Clinton either. U.S.-born Hispanics do view Clinton significantly more favorably than Trump, which should help her fare better at the polls among this group, the vast majority of whom are registered to vote.
Clinton, however, is highly popular among foreign-born Hispanics, and her support among this group is the primary reason she has such a large advantage in favorability over Trump among all U.S. Hispanics. But low reported voter registration among foreign-born Hispanics limits her ability to leverage them as a voting bloc. This makes it clear why Clinton's campaign could most likely benefit by prioritizing the registration of the roughly one in six nonregistered Hispanics who want to register but have still not done so.
Historical data are available in Gallup Analytics.
Survey Methods
Results for this Gallup poll are based on telephone interviews conducted June 7-July 1, 2016, with a random sample of 3,270 adults, aged 18 and older, living in all 50 U.S. states and the District of Columbia. For results based on the total sample of national adults, the margin of sampling error is ±3 percentage points at the 95% confidence level. For results based on the total sample of 1,320 non-Hispanic whites, the margin of sampling error is ±4 percentage points at the 95% confidence level. For results based on the total sample of 912 non-Hispanic blacks, the margin of sampling error is ±5 percentage points at the 95% confidence level. For results based on the total sample of 906 Hispanics, the margin of sampling error is ±6 percentage points at the 95% confidence level. All reported margins of sampling error include computed design effects for weighting.
Each sample of national adults includes a minimum quota of 60% cellphone respondents and 40% landline respondents, with additional minimum quotas by time zone within region. Landline and cellular telephone numbers are selected using random-digit-dial methods.
View survey methodology, complete question responses and trends.
Learn more about how the Gallup Poll Social Series works.