Story Highlights
- 69% of U.S. adults are sure they will vote, down from 76% in 2012
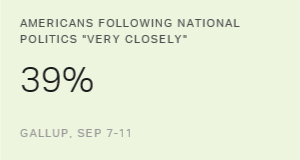
- 72% have given a lot of thought to the election; lowest figure since 2000
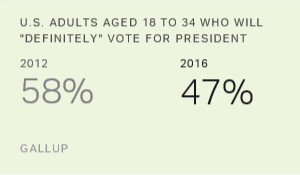
- Intent to vote is down sharply among U.S. adults aged 18 to 34
PRINCETON, N.J. -- Amid the news frenzy leading up to the first general election debate of 2016, fewer U.S. adults rate themselves highly likely to vote for president than did so in September of each of the past four presidential election years. Sixty-nine percent of Americans currently rate their chances of voting a "10" on a 1-to-10 likelihood of voting scale. That is down from 76% in 2012 and 80% in 2008, the year with the highest turnout since 2000.
| 2000 | 2004 | 2008 | 2012 | 2016 | |||||||||||||||||||||||||||||||||||||||||||||||||||||||||||||||||||||||||||||||||||||||||||||||
|---|---|---|---|---|---|---|---|---|---|---|---|---|---|---|---|---|---|---|---|---|---|---|---|---|---|---|---|---|---|---|---|---|---|---|---|---|---|---|---|---|---|---|---|---|---|---|---|---|---|---|---|---|---|---|---|---|---|---|---|---|---|---|---|---|---|---|---|---|---|---|---|---|---|---|---|---|---|---|---|---|---|---|---|---|---|---|---|---|---|---|---|---|---|---|---|---|---|---|---|
| % | % | % | % | % | |||||||||||||||||||||||||||||||||||||||||||||||||||||||||||||||||||||||||||||||||||||||||||||||
| 10 | 74 | 78 | 80 | 76 | 69 | ||||||||||||||||||||||||||||||||||||||||||||||||||||||||||||||||||||||||||||||||||||||||||||||
| 8 or 9 | 14 | 11 | 9 | 9 | 11 | ||||||||||||||||||||||||||||||||||||||||||||||||||||||||||||||||||||||||||||||||||||||||||||||
| 1 to 7 | 10 | 10 | 9 | 14 | 18 | ||||||||||||||||||||||||||||||||||||||||||||||||||||||||||||||||||||||||||||||||||||||||||||||
| Not sure | 3 | 1 | 2 | 1 | 3 | ||||||||||||||||||||||||||||||||||||||||||||||||||||||||||||||||||||||||||||||||||||||||||||||
| Voter turnout^ | 51.2 | 56.7 | 58.2 | 54.9 | n/a | ||||||||||||||||||||||||||||||||||||||||||||||||||||||||||||||||||||||||||||||||||||||||||||||
| ^ Based on voting age population (VAP); source: http://www.presidency.ucsb.edu/data/turnout.php; polls conducted in September of each year | |||||||||||||||||||||||||||||||||||||||||||||||||||||||||||||||||||||||||||||||||||||||||||||||||||
| Gallup | |||||||||||||||||||||||||||||||||||||||||||||||||||||||||||||||||||||||||||||||||||||||||||||||||||
Gallup has historically asked this question as part of a set of questions gauging likelihood to vote. Another likely voter question asks Americans how much thought they have given to the election -- quite a lot or only a little. The 72% currently giving "a lot" of thought to the race is similar to what Gallup recorded in September 2012, but is down from 2004 and 2008.
| 2000 | 2004 | 2008 | 2012 | 2016 | |||||||||||||||||||||||||||||||||||||||||||||||||||||||||||||||||||||||||||||||||||||||||||||||
|---|---|---|---|---|---|---|---|---|---|---|---|---|---|---|---|---|---|---|---|---|---|---|---|---|---|---|---|---|---|---|---|---|---|---|---|---|---|---|---|---|---|---|---|---|---|---|---|---|---|---|---|---|---|---|---|---|---|---|---|---|---|---|---|---|---|---|---|---|---|---|---|---|---|---|---|---|---|---|---|---|---|---|---|---|---|---|---|---|---|---|---|---|---|---|---|---|---|---|---|
| % | % | % | % | % | |||||||||||||||||||||||||||||||||||||||||||||||||||||||||||||||||||||||||||||||||||||||||||||||
| Quite a lot | 59 | 77 | 80 | 74 | 72 | ||||||||||||||||||||||||||||||||||||||||||||||||||||||||||||||||||||||||||||||||||||||||||||||
| Some (volunteered) | 8 | 3 | 4 | 4 | 2 | ||||||||||||||||||||||||||||||||||||||||||||||||||||||||||||||||||||||||||||||||||||||||||||||
| Only a little | 30 | 16 | 15 | 20 | 22 | ||||||||||||||||||||||||||||||||||||||||||||||||||||||||||||||||||||||||||||||||||||||||||||||
| None (volunteered) | 2 | 3 | 1 | 2 | 4 | ||||||||||||||||||||||||||||||||||||||||||||||||||||||||||||||||||||||||||||||||||||||||||||||
| No opinion | 1 | 0 | 0 | 0 | 0 | ||||||||||||||||||||||||||||||||||||||||||||||||||||||||||||||||||||||||||||||||||||||||||||||
| Polls conducted in September of each year | |||||||||||||||||||||||||||||||||||||||||||||||||||||||||||||||||||||||||||||||||||||||||||||||||||
| Gallup | |||||||||||||||||||||||||||||||||||||||||||||||||||||||||||||||||||||||||||||||||||||||||||||||||||
These figures could change between now and Election Day. However, while the percentage giving quite a lot of thought to the election usually increases by several percentage points between September and November, the percentage rating their likelihood of voting a "10" typically does not.
| 2000 | 2004 | 2008 | 2012 | |||||||||||||||||||||||||||||||||||||||||||||||||||||||||||||||||||||||||||||||||||||||||||||||||
|---|---|---|---|---|---|---|---|---|---|---|---|---|---|---|---|---|---|---|---|---|---|---|---|---|---|---|---|---|---|---|---|---|---|---|---|---|---|---|---|---|---|---|---|---|---|---|---|---|---|---|---|---|---|---|---|---|---|---|---|---|---|---|---|---|---|---|---|---|---|---|---|---|---|---|---|---|---|---|---|---|---|---|---|---|---|---|---|---|---|---|---|---|---|---|---|---|---|---|---|---|
| % | % | % | % | |||||||||||||||||||||||||||||||||||||||||||||||||||||||||||||||||||||||||||||||||||||||||||||||||
| Have given "quite a lot" of thought to election | ||||||||||||||||||||||||||||||||||||||||||||||||||||||||||||||||||||||||||||||||||||||||||||||||||||
| September | 59 | 77 | 80 | 74 | ||||||||||||||||||||||||||||||||||||||||||||||||||||||||||||||||||||||||||||||||||||||||||||||||
| Final pre-election | 70 | 84 | 81 | 78 | ||||||||||||||||||||||||||||||||||||||||||||||||||||||||||||||||||||||||||||||||||||||||||||||||
| Will definitely vote ("10") | ||||||||||||||||||||||||||||||||||||||||||||||||||||||||||||||||||||||||||||||||||||||||||||||||||||
| September | 74 | 78 | 80 | 76 | ||||||||||||||||||||||||||||||||||||||||||||||||||||||||||||||||||||||||||||||||||||||||||||||||
| Final pre-election | 67 | 82 | 77 | 75 | ||||||||||||||||||||||||||||||||||||||||||||||||||||||||||||||||||||||||||||||||||||||||||||||||
| Gallup | ||||||||||||||||||||||||||||||||||||||||||||||||||||||||||||||||||||||||||||||||||||||||||||||||||||
Intent to Vote Sagging Among Both Major Party Groups
Democrats and independents who lean Democratic currently report giving the same level of thought to the election as they did in September 2012 (70%), whereas thought given is down slightly among Republicans and independents who lean Republican, from 81% to 75%. At the same time, intent to vote is down by a similar proportion among both party groups.
Still, by 76% to 65%, Republicans remain more likely than Democrats to say they will definitely vote -- a gap that is similar to 2012, but higher than in previous elections. Further, the 65% of Democrats saying they will definitely vote is well below their average for the prior four presidential elections (77%), whereas the 76% of Republicans saying they will definitely vote is only a bit lower than their prior average (81%).
| 2000 | 2004 | 2008 | 2012 | 2016 | ||||||||||||||||||||||||||||||||||||||||||||||||||||||||||||||||||||||||||||||||||||||||||||||||
|---|---|---|---|---|---|---|---|---|---|---|---|---|---|---|---|---|---|---|---|---|---|---|---|---|---|---|---|---|---|---|---|---|---|---|---|---|---|---|---|---|---|---|---|---|---|---|---|---|---|---|---|---|---|---|---|---|---|---|---|---|---|---|---|---|---|---|---|---|---|---|---|---|---|---|---|---|---|---|---|---|---|---|---|---|---|---|---|---|---|---|---|---|---|---|---|---|---|---|---|---|
| % | % | % | % | % | ||||||||||||||||||||||||||||||||||||||||||||||||||||||||||||||||||||||||||||||||||||||||||||||||
| Have given "quite a lot" of thought to election | ||||||||||||||||||||||||||||||||||||||||||||||||||||||||||||||||||||||||||||||||||||||||||||||||||||
| Republicans/Republican leaners | 65 | 81 | 81 | 81 | 75 | |||||||||||||||||||||||||||||||||||||||||||||||||||||||||||||||||||||||||||||||||||||||||||||||
| Democrats/Democratic leaners | 57 | 76 | 80 | 70 | 70 | |||||||||||||||||||||||||||||||||||||||||||||||||||||||||||||||||||||||||||||||||||||||||||||||
| Will definitely vote ("10") | ||||||||||||||||||||||||||||||||||||||||||||||||||||||||||||||||||||||||||||||||||||||||||||||||||||
| Republicans/Republican leaners | 79 | 81 | 82 | 83 | 76 | |||||||||||||||||||||||||||||||||||||||||||||||||||||||||||||||||||||||||||||||||||||||||||||||
| Democrats/Democratic leaners | 74 | 78 | 80 | 74 | 65 | |||||||||||||||||||||||||||||||||||||||||||||||||||||||||||||||||||||||||||||||||||||||||||||||
| Gallup | ||||||||||||||||||||||||||||||||||||||||||||||||||||||||||||||||||||||||||||||||||||||||||||||||||||
One reason for the decline in Democrats' intent to vote could be the depressed percentage of young voters this year saying they will definitely vote -- now at 47%, down from 58% in 2012 and from a peak of 74% in 2008.
In contrast to the 11-point drop since 2012 in young adults' voting intention, there has been a seven-point decline among 35- to 54-year-olds and virtually no decline among those aged 55 and older.
| 2000 | 2004 | 2008 | 2012 | 2016 | |||||||||||||||||||||||||||||||||||||||||||||||||||||||||||||||||||||||||||||||||||||||||||||||
|---|---|---|---|---|---|---|---|---|---|---|---|---|---|---|---|---|---|---|---|---|---|---|---|---|---|---|---|---|---|---|---|---|---|---|---|---|---|---|---|---|---|---|---|---|---|---|---|---|---|---|---|---|---|---|---|---|---|---|---|---|---|---|---|---|---|---|---|---|---|---|---|---|---|---|---|---|---|---|---|---|---|---|---|---|---|---|---|---|---|---|---|---|---|---|---|---|---|---|---|
| % | % | % | % | % | |||||||||||||||||||||||||||||||||||||||||||||||||||||||||||||||||||||||||||||||||||||||||||||||
| U.S. adults | 74 | 78 | 80 | 75 | 69 | ||||||||||||||||||||||||||||||||||||||||||||||||||||||||||||||||||||||||||||||||||||||||||||||
| 18 to 34 | 60 | 67 | 74 | 58 | 47 | ||||||||||||||||||||||||||||||||||||||||||||||||||||||||||||||||||||||||||||||||||||||||||||||
| 35 to 54 | 77 | 81 | 81 | 79 | 72 | ||||||||||||||||||||||||||||||||||||||||||||||||||||||||||||||||||||||||||||||||||||||||||||||
| 55+ | 81 | 84 | 82 | 83 | 82 | ||||||||||||||||||||||||||||||||||||||||||||||||||||||||||||||||||||||||||||||||||||||||||||||
| Gallup | |||||||||||||||||||||||||||||||||||||||||||||||||||||||||||||||||||||||||||||||||||||||||||||||||||
Given Hispanics' lower propensity to vote due to citizenship and other issues, this recent decline in intent to vote among 18- to 34-year-olds may partly reflect the influence of the growing and disproportionately youthful Hispanic population. But even when looking only at non-Hispanic adults, intent to vote among those aged 18 to 34 has dropped substantially more than among older Americans.
| 2000 | 2004 | 2008 | 2012 | 2016 | |||||||||||||||||||||||||||||||||||||||||||||||||||||||||||||||||||||||||||||||||||||||||||||||
|---|---|---|---|---|---|---|---|---|---|---|---|---|---|---|---|---|---|---|---|---|---|---|---|---|---|---|---|---|---|---|---|---|---|---|---|---|---|---|---|---|---|---|---|---|---|---|---|---|---|---|---|---|---|---|---|---|---|---|---|---|---|---|---|---|---|---|---|---|---|---|---|---|---|---|---|---|---|---|---|---|---|---|---|---|---|---|---|---|---|---|---|---|---|---|---|---|---|---|---|
| % | % | % | % | % | |||||||||||||||||||||||||||||||||||||||||||||||||||||||||||||||||||||||||||||||||||||||||||||||
| Non-Hispanic U.S. adults | 75 | 79 | 81 | 79 | 73 | ||||||||||||||||||||||||||||||||||||||||||||||||||||||||||||||||||||||||||||||||||||||||||||||
| 18 to 34 | 61 | 66 | 76 | 62 | 51 | ||||||||||||||||||||||||||||||||||||||||||||||||||||||||||||||||||||||||||||||||||||||||||||||
| 35 to 54 | 78 | 81 | 81 | 81 | 78 | ||||||||||||||||||||||||||||||||||||||||||||||||||||||||||||||||||||||||||||||||||||||||||||||
| 55+ | 82 | 84 | 83 | 86 | 83 | ||||||||||||||||||||||||||||||||||||||||||||||||||||||||||||||||||||||||||||||||||||||||||||||
| Gallup | |||||||||||||||||||||||||||||||||||||||||||||||||||||||||||||||||||||||||||||||||||||||||||||||||||
Bottom Line
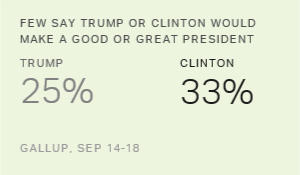
While Americans are giving a similar level of thought to the presidential election compared with previous years, the percentage saying they are certain they will vote is lagging, particularly among young adults. This likely reflects the persistently poor images of both major party nominees, as well as Hillary Clinton's difficulty in winning over the young adults who were much more favorable toward Bernie Sanders than toward her when Sanders was running for the Democratic nomination. Thus, while the debates could attract record audiences and the election is sure to dominate news coverage for the next several weeks, as long as Clinton and her Republican rival, Donald Trump, remain unpopular, voter turnout -- particularly among younger Americans -- may suffer.
Historical data are available in Gallup Analytics.
Survey Methods
Results for this Gallup poll are based on telephone interviews conducted Sept. 14-18, 2016, with a random sample of 1,033 adults, aged 18 and older, living in all 50 U.S. states and the District of Columbia. For results based on the total sample of national adults, the margin of sampling error is ±4 percentage points at the 95% confidence level. All reported margins of sampling error include computed design effects for weighting.
Each sample of national adults includes a minimum quota of 60% cellphone respondents and 40% landline respondents, with additional minimum quotas by time zone within region. Landline and cellular telephone numbers are selected using random-digit-dial methods.
Learn more about how the Gallup Poll Social Series works.