Story Highlights
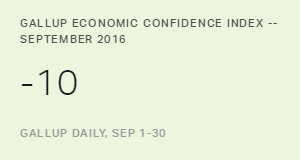
- Confidence stands at -10, unchanged from -11 in August
- Confidence improved compared with the spring and summer months
- The current conditions component is one point below its all-time high
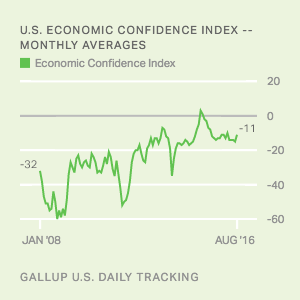
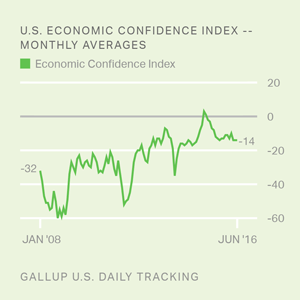
WASHINGTON, D.C. -- The modest improvement in Americans' economic confidence first evident after the Democratic National Convention continued for a second consecutive month. Gallup's U.S. Economic Confidence Index averaged -10 for the month of September, in line with August's average of -11 and five points higher than the index's 12-month low in July.
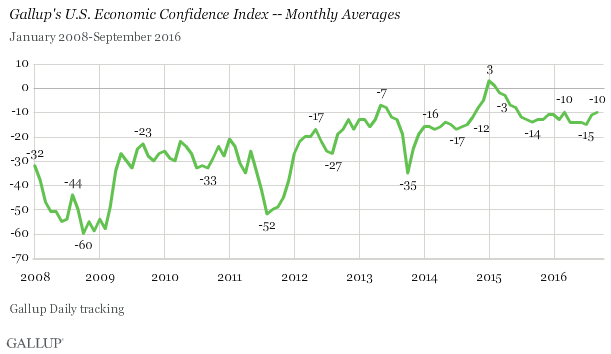
The index began the year close to its current level, with January's score at -11. Confidence fell from -10 in March to -14 in April amid rising gas prices and reports of slow economic growth in the first quarter. The index slipped to -15 in July, nominally the worst reading since September 2014. But despite its relatively low monthly average, confidence rebounded in the final week of July. As the Democratic Party assembled in Philadelphia for its July 25-28 national convention, Democrats' confidence in the economy rallied and the July 25-31 weekly average increased by six points to -10.
Although the August and September monthly economic confidence averages represent an improvement from the index's recent slump, they remain below the post-recession high of +3 recorded in January 2015.
Long-term economic confidence has broadly improved since October 2008, when it fell to a record low of -60. But, much like the economy itself, Americans' recovering confidence in the economy has not always been smooth, with several sharp drops in August 2011 (-52) and October 2013 (-35), even as the general trend has been one of upward movement.
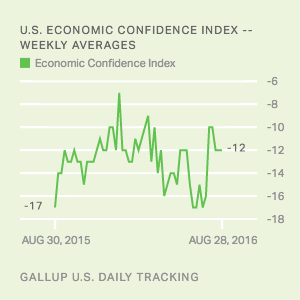
For the week of Sept. 26-Oct. 2, confidence in the economy improved slightly, with the index's weekly average climbing from -12 to -9.
Current Conditions Score Near Post-Recession High
Gallup's U.S. Economic Confidence Index is the average of two components: how Americans rate current economic conditions and whether they feel the economy is improving or getting worse. The index has a theoretical maximum of +100 if all Americans say the economy is doing well and improving, and a theoretical minimum of -100 if all Americans say the economy is doing poorly and getting worse.
In September, an equal percentage of Americans (28%) rated current economic conditions as "excellent" or "good" and "poor." Overall, the monthly average of the current conditions component stood at 0. While this score is essentially unchanged from the August value (-2), it is only one point below its January 2015 post-recession high of +1.
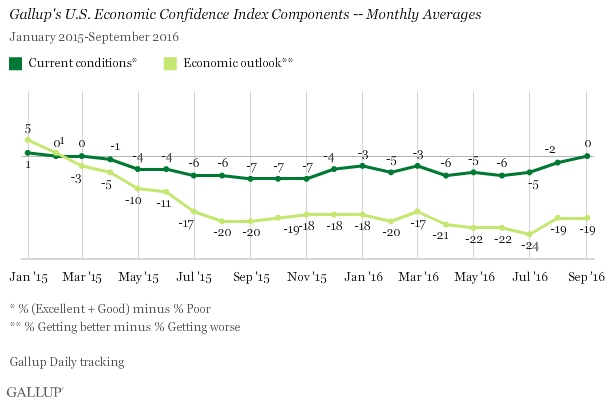
The economic outlook component stayed put in September, averaging -19. The September outlook score reflected 38% of Americans saying the economy was "getting better," and 57% saying it was "getting worse."
Bottom Line
Americans' confidence in the economy was stable in September but was higher than levels seen in April through July of this year. However, confidence remains significantly below the post-recession peak of +3 it hit in January 2015, despite other economic indicators that suggest a brighter picture. The U.S. unemployment rate has fallen by nearly one percentage point since January 2015, and stock market indexes have generally grown.
Gallup's findings do not necessarily dispute any of these metrics -- the current conditions component of the index is one point shy of its post-recession high, indicating feelings about economy's present state are as strong as they have been since the Great Recession officially ended in 2009. Additionally, net new hiring -- another Gallup economic metric -- is at an eight-year high.
But the level of Americans who believe the national economy is getting better has fallen sharply since reaching +5 in January 2015; the index's economic outlook component stood at -19 last month. Granted, its most recent monthly average represents a slight improvement from July (-24), but it remains well below its post-recession high. It seems plausible that the economic uncertainty stemming from the 2016 presidential election may have contributed to this phenomenon. If so, the index may not show significant improvement until the electoral contest has been decided.
Survey Methods
Results for this Gallup poll are based on telephone interviews conducted Sept. 1-30, 2016, on Gallup Daily tracking, with a random sample of 14,715 adults, aged 18 and older, living in all 50 U.S. states and the District of Columbia. For results based on the total sample of national adults, the margin of sampling error is ±1 percentage point at the 95% confidence level. All reported margins of sampling error include computed design effects for weighting.
Each sample of national adults includes a minimum quota of 60% cellphone respondents and 40% landline respondents, with additional minimum quotas by time zone within region. Landline and cellular telephone numbers are selected using random-digit-dial methods.
Learn more about how the Gallup U.S. Daily works.