Story Highlights
- Marks 11th straight week of virtually no week-to-week change
- Economic confidence is on track to be its most stable year since 2008
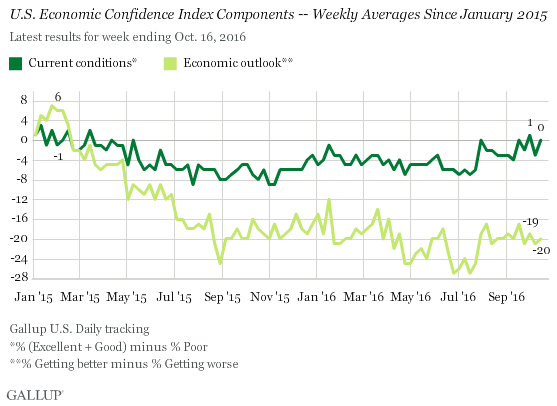
- Current conditions component at -1, economic outlook at -20
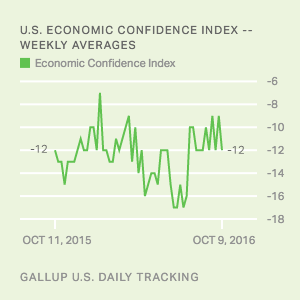
WASHINGTON, D.C. -- Americans' attitudes about the economy were unchanged last week, with Gallup's U.S. Economic Confidence Index holding at -10, consistent with levels since late July. Economic confidence is on track to have its most stable year since Gallup began tracking the metric in 2008.
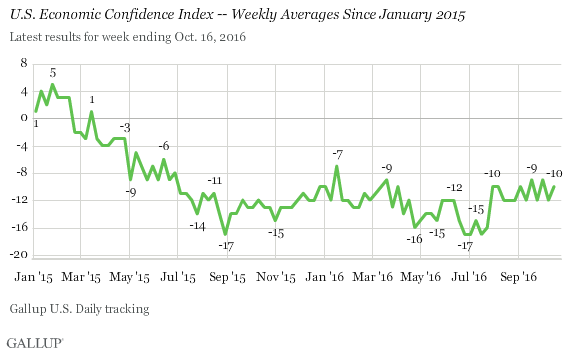
Economic attitudes in 2016 have more closely resembled the lower confidence levels in the second half of 2015 rather than levels in the first half of 2015 when confidence hit its post-recession high. At the same time, economic confidence is currently much higher than it was in 2008 and 2009.
Although feelings about the economy have not been especially positive or negative in 2016, they have been stable. For the first 41 weeks of 2016, the index's standard deviation -- a measure of its volatility -- is 2.4 points. This is nearly half the volatility measured in 2010 and 2014 (standard deviation of 4.1 points), the two next-calmest years.
| Annual average of weekly scores | Annual average standard deviation | ||||||||||||||||||||||||||||||||||||||||||||||||||||||||||||||||||||||||||||||||||||||||||||||||||
|---|---|---|---|---|---|---|---|---|---|---|---|---|---|---|---|---|---|---|---|---|---|---|---|---|---|---|---|---|---|---|---|---|---|---|---|---|---|---|---|---|---|---|---|---|---|---|---|---|---|---|---|---|---|---|---|---|---|---|---|---|---|---|---|---|---|---|---|---|---|---|---|---|---|---|---|---|---|---|---|---|---|---|---|---|---|---|---|---|---|---|---|---|---|---|---|---|---|---|---|
| % | pct. pts. | ||||||||||||||||||||||||||||||||||||||||||||||||||||||||||||||||||||||||||||||||||||||||||||||||||
| 2016 | -12* | 2.4* | |||||||||||||||||||||||||||||||||||||||||||||||||||||||||||||||||||||||||||||||||||||||||||||||||
| 2015 | -8 | 5.7 | |||||||||||||||||||||||||||||||||||||||||||||||||||||||||||||||||||||||||||||||||||||||||||||||||
| 2014 | -14 | 4.1 | |||||||||||||||||||||||||||||||||||||||||||||||||||||||||||||||||||||||||||||||||||||||||||||||||
| 2013 | -16 | 7.9 | |||||||||||||||||||||||||||||||||||||||||||||||||||||||||||||||||||||||||||||||||||||||||||||||||
| 2012 | -21 | 4.8 | |||||||||||||||||||||||||||||||||||||||||||||||||||||||||||||||||||||||||||||||||||||||||||||||||
| 2011 | -37 | 10.8 | |||||||||||||||||||||||||||||||||||||||||||||||||||||||||||||||||||||||||||||||||||||||||||||||||
| 2010 | -28 | 4.1 | |||||||||||||||||||||||||||||||||||||||||||||||||||||||||||||||||||||||||||||||||||||||||||||||||
| 2009 | -34 | 11.6 | |||||||||||||||||||||||||||||||||||||||||||||||||||||||||||||||||||||||||||||||||||||||||||||||||
| 2008 | -49 | 9.0 | |||||||||||||||||||||||||||||||||||||||||||||||||||||||||||||||||||||||||||||||||||||||||||||||||
| *Partial data | |||||||||||||||||||||||||||||||||||||||||||||||||||||||||||||||||||||||||||||||||||||||||||||||||||
| Gallup Daily tracking, 2008-2016 | |||||||||||||||||||||||||||||||||||||||||||||||||||||||||||||||||||||||||||||||||||||||||||||||||||
As Gallup's U.S. Economic Confidence Index has flatlined, so have other economic measures. For instance, gross domestic product growth has been at roughly 1% since the last quarter of 2015, in contrast to previous years, in which growth was choppier from quarter to quarter. Meanwhile, the unemployment rate has remained near 5.0% all year, its lowest rate since before the recession.
Gallup's U.S. Economic Confidence Index is the average of two components: how Americans rate current economic conditions and whether they feel the economy is improving or getting worse. The index has a theoretical maximum of +100 if all Americans say the economy is doing well and improving, and a theoretical minimum of -100 if all Americans say the economy is doing poorly and getting worse.
Last week, the current conditions component stood at 0, with 29% saying the economy was "good" or "excellent," and 29% saying it was "poor." The current conditions component stood at -3 one week earlier.
Fewer than four in 10 Americans (38%) said economic conditions in the country were "getting better" last week, essentially unchanged from the 37% who said the same one week earlier. Fifty-eight percent of Americans said economic conditions were "getting worse," bringing the economic outlook score to -20. The previous week's economic outlook component stood at -21.
Bottom Line
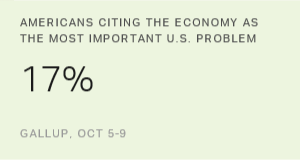
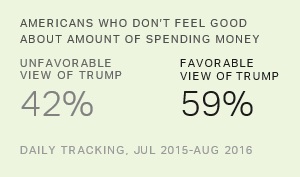
Gallup's U.S. Economic Confidence Index has been stable for most of the year, lingering at a level that is slightly below where it was in early 2015 but well above where it was in the initial years following the Great Recession. But its inertia hardly signifies that it has lost its importance as a political issue -- economic anxiety has figured prominently in this year's presidential campaigns. A Gallup analysis found Americans who are feeling financially insecure are more likely to see Donald Trump favorably, and a plurality of Americans (17%) name the economy the most important problem facing the nation. So confidence may have stabilized for the moment, but it has stabilized at a level some Americans are unhappy with.
Survey Methods
Results for this Gallup poll are based on telephone interviews conducted Oct. 10-16, 2016, on the Gallup U.S. Daily survey, with a random sample of 3,555 adults, aged 18 and older, living in all 50 U.S. states and the District of Columbia. For results based on the total sample of national adults, the margin of sampling error is ±2 percentage points at the 95% confidence level. All reported margins of sampling error include computed design effects for weighting.
Each sample of national adults includes a minimum quota of 60% cellphone respondents and 40% landline respondents, with additional minimum quotas by time zone within region. Landline and cellular telephone numbers are selected using random-digit-dial methods.
Learn more about how the Gallup U.S. Daily works.