Story Highlights
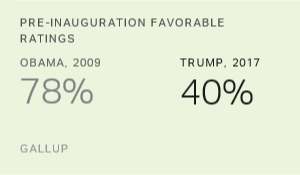
- Trump's 40% favorable is about half of Obama's pre-inauguration rating
- Also lower than favorables for Presidents-elect G.W. Bush and Clinton
- Pence's image more positive than Trump's, but low for a vice president-elect
WASHINGTON, D.C. -- President-elect Donald Trump approaches Inauguration Day with a significantly lower favorable rating than his three immediate predecessors received when they were presidents-elect. Trump's 40% favorable rating is roughly half of what Barack Obama enjoyed before his inauguration in 2009 (78%) and is much lower than the pre-inaugural ratings for George W. Bush (62%) and Bill Clinton (66%).
| Favorable | Unfavorable | No opinion | |||||||||||||||||||||||||||||||||||||||||||||||||||||||||||||||||||||||||||||||||||||||||||||||||
|---|---|---|---|---|---|---|---|---|---|---|---|---|---|---|---|---|---|---|---|---|---|---|---|---|---|---|---|---|---|---|---|---|---|---|---|---|---|---|---|---|---|---|---|---|---|---|---|---|---|---|---|---|---|---|---|---|---|---|---|---|---|---|---|---|---|---|---|---|---|---|---|---|---|---|---|---|---|---|---|---|---|---|---|---|---|---|---|---|---|---|---|---|---|---|---|---|---|---|---|
| % | % | % | |||||||||||||||||||||||||||||||||||||||||||||||||||||||||||||||||||||||||||||||||||||||||||||||||
| Donald Trump (Jan 4-8, 2017) | 40 | 55 | 5 | ||||||||||||||||||||||||||||||||||||||||||||||||||||||||||||||||||||||||||||||||||||||||||||||||
| Barack Obama (Jan 9-11, 2009) | 78 | 18 | 5 | ||||||||||||||||||||||||||||||||||||||||||||||||||||||||||||||||||||||||||||||||||||||||||||||||
| George W. Bush (Jan 15-16, 2001) | 62 | 36 | 2 | ||||||||||||||||||||||||||||||||||||||||||||||||||||||||||||||||||||||||||||||||||||||||||||||||
| Bill Clinton (Jan 18-19, 1993) | 66 | 26 | 8 | ||||||||||||||||||||||||||||||||||||||||||||||||||||||||||||||||||||||||||||||||||||||||||||||||
| GALLUP | |||||||||||||||||||||||||||||||||||||||||||||||||||||||||||||||||||||||||||||||||||||||||||||||||||
The latest findings were collected in a Jan. 4-8 Gallup poll.
Of the four most recent incoming presidents, Trump is the only president-elect whose unfavorable rating outweighs his favorable score; a majority of 55% of Americans hold a negative view of Trump, compared with 18% who did so for Obama, 26% for Clinton and 36% for Bush. Gallup has asked favorable and unfavorable ratings for key figures in this format since 1992, so only comparisons to Clinton, Bush and Obama are available.
Trump's latest favorable rating -- along with his post-election November and December ratings -- remains slightly higher than during the course of the presidential campaign, when it never rose above 38%, including 34% in the week before the election. The three previous presidents-elect also saw improvement in their images after winning the election. Obama's favorable image increased 16 percentage points, Clinton's rose 15 points and Bush's seven points between Gallup's final pre-election poll and its last pre-inauguration poll in prior transfers of power.
Trump Receives Lower Favorables From His Own Party Than Predecessors Did
While the large majority of Republicans (82%) hold a favorable opinion of President-elect Trump, that is lower than favorable ratings prior presidents have enjoyed among members of their own party at this point in their ascension to the White House.
Bush had nearly unanimous favorability from fellow Republicans in January 2001, with 97% of GOP respondents rating him favorably at that time. Obama (95%) and Clinton (92%) enjoyed favorable opinions from more than nine in 10 Democrats.
| Donald Trump | Barack Obama | George W. Bush | Bill Clinton | ||||||||||||||||||||||||||||||||||||||||||||||||||||||||||||||||||||||||||||||||||||||||||||||||
|---|---|---|---|---|---|---|---|---|---|---|---|---|---|---|---|---|---|---|---|---|---|---|---|---|---|---|---|---|---|---|---|---|---|---|---|---|---|---|---|---|---|---|---|---|---|---|---|---|---|---|---|---|---|---|---|---|---|---|---|---|---|---|---|---|---|---|---|---|---|---|---|---|---|---|---|---|---|---|---|---|---|---|---|---|---|---|---|---|---|---|---|---|---|---|---|---|---|---|---|
| % | % | % | % | ||||||||||||||||||||||||||||||||||||||||||||||||||||||||||||||||||||||||||||||||||||||||||||||||
| National adults | 40 | 78 | 62 | 66 | |||||||||||||||||||||||||||||||||||||||||||||||||||||||||||||||||||||||||||||||||||||||||||||||
| Republicans | 82 | 60 | 97 | 42 | |||||||||||||||||||||||||||||||||||||||||||||||||||||||||||||||||||||||||||||||||||||||||||||||
| Independents | 33 | 75 | 60 | 61 | |||||||||||||||||||||||||||||||||||||||||||||||||||||||||||||||||||||||||||||||||||||||||||||||
| Democrats | 8 | 95 | 31 | 92 | |||||||||||||||||||||||||||||||||||||||||||||||||||||||||||||||||||||||||||||||||||||||||||||||
| GALLUP | |||||||||||||||||||||||||||||||||||||||||||||||||||||||||||||||||||||||||||||||||||||||||||||||||||
Vice President-Elect Pence Also Struggles With Historically Low Favorability
Gallup's Jan. 4-8 poll also asked Americans for their opinions of the incoming vice president and first lady. Currently, 42% of Americans have a positive opinion and 37% a negative opinion of Vice President-elect Mike Pence, with 21% not yet holding an opinion.
The previous three incoming vice presidents had favorable ratings above the majority level, including 53% for Joe Biden, 61% for Dick Cheney and 63% for Al Gore. In contrast to these other vice presidents' ratings, Pence's unfavorable is nearly as high as his favorable rating. The percentage of Americans unfamiliar with Pence is also slightly higher than it was for his predecessors.
| Favorable | Unfavorable | No opinion | |||||||||||||||||||||||||||||||||||||||||||||||||||||||||||||||||||||||||||||||||||||||||||||||||
|---|---|---|---|---|---|---|---|---|---|---|---|---|---|---|---|---|---|---|---|---|---|---|---|---|---|---|---|---|---|---|---|---|---|---|---|---|---|---|---|---|---|---|---|---|---|---|---|---|---|---|---|---|---|---|---|---|---|---|---|---|---|---|---|---|---|---|---|---|---|---|---|---|---|---|---|---|---|---|---|---|---|---|---|---|---|---|---|---|---|---|---|---|---|---|---|---|---|---|---|
| % | % | % | |||||||||||||||||||||||||||||||||||||||||||||||||||||||||||||||||||||||||||||||||||||||||||||||||
| Mike Pence (Jan 4-8, 2017) | 42 | 37 | 21 | ||||||||||||||||||||||||||||||||||||||||||||||||||||||||||||||||||||||||||||||||||||||||||||||||
| Joe Biden (Jan 9-11, 2009) | 53 | 29 | 18 | ||||||||||||||||||||||||||||||||||||||||||||||||||||||||||||||||||||||||||||||||||||||||||||||||
| Dick Cheney (Jan 15-16, 2001) | 61 | 23 | 16 | ||||||||||||||||||||||||||||||||||||||||||||||||||||||||||||||||||||||||||||||||||||||||||||||||
| Al Gore (Jan 18-19, 1993) | 63 | 22 | 15 | ||||||||||||||||||||||||||||||||||||||||||||||||||||||||||||||||||||||||||||||||||||||||||||||||
| GALLUP | |||||||||||||||||||||||||||||||||||||||||||||||||||||||||||||||||||||||||||||||||||||||||||||||||||
Melania Trump's favorable rating of 37% is equal to the percentage of Americans who have an unfavorable view (37%) of her. However, about one in four Americans (26%) are unfamiliar with or have no opinion of her.
The soon-to-be first lady's favorable ratings are significantly lower than previous first ladies' ratings as their husbands prepared to take office. Michelle Obama (68%), Laura Bush (56%) and Hillary Clinton (59%) each had majority favorable ratings at this point before Inauguration Day.
| Favorable | Unfavorable | No opinion | |||||||||||||||||||||||||||||||||||||||||||||||||||||||||||||||||||||||||||||||||||||||||||||||||
|---|---|---|---|---|---|---|---|---|---|---|---|---|---|---|---|---|---|---|---|---|---|---|---|---|---|---|---|---|---|---|---|---|---|---|---|---|---|---|---|---|---|---|---|---|---|---|---|---|---|---|---|---|---|---|---|---|---|---|---|---|---|---|---|---|---|---|---|---|---|---|---|---|---|---|---|---|---|---|---|---|---|---|---|---|---|---|---|---|---|---|---|---|---|---|---|---|---|---|---|
| % | % | % | |||||||||||||||||||||||||||||||||||||||||||||||||||||||||||||||||||||||||||||||||||||||||||||||||
| Melania Trump (Jan 4-8, 2017) | 37 | 37 | 26 | ||||||||||||||||||||||||||||||||||||||||||||||||||||||||||||||||||||||||||||||||||||||||||||||||
| Michelle Obama (Jan 9-11, 2009) | 68 | 18 | 13 | ||||||||||||||||||||||||||||||||||||||||||||||||||||||||||||||||||||||||||||||||||||||||||||||||
| Laura Bush (Jan 15-16, 2001) | 56 | 11 | 33 | ||||||||||||||||||||||||||||||||||||||||||||||||||||||||||||||||||||||||||||||||||||||||||||||||
| Hillary Clinton (Jan 18-19, 1993) | 59 | 26 | 15 | ||||||||||||||||||||||||||||||||||||||||||||||||||||||||||||||||||||||||||||||||||||||||||||||||
| GALLUP | |||||||||||||||||||||||||||||||||||||||||||||||||||||||||||||||||||||||||||||||||||||||||||||||||||
Bottom Line
Trump will enter the White House in a strong political position, with his party controlling both chambers of Congress. But he enters office with a significantly more negative image than prior presidents-elect have had and with a less positive image even among those who identify with his own party. The president-elect's general unpopularity is an unprecedented hurdle, whose impact on his ability to govern remains to be seen. As he takes office, Trump also faces much greater political polarization than his successors, even though all recent presidents have faced fairly stiff opposition from nonsupporters once in office.
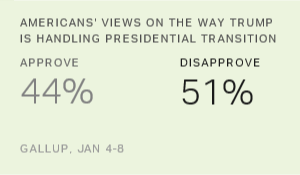
Trump's approval ratings for handling his presidential transition are slightly higher than his favorable ratings and may be a better measure of his performance to date. But those too are worse than other presidents received during their transitions, suggesting that Trump's initial job approval ratings after the inauguration may not reflect the "honeymoon" period that newly elected presidents traditionally enjoy.
Historical data are available in Gallup Analytics.
Survey Methods
Results for this Gallup poll are based on telephone interviews conducted Jan. 4-8, 2017, with a random sample of 1,032 adults, aged 18 and older, living in all 50 U.S. states and the District of Columbia. For results based on the total sample of national adults, the margin of sampling error is ±4 percentage points at the 95% confidence level. All reported margins of sampling error include computed design effects for weighting.
Each sample of national adults includes a minimum quota of 70% cellphone respondents and 30% landline respondents, with additional minimum quotas by time zone within region. Landline and cellular telephone numbers are selected using random-digit-dial methods.
View survey methodology, complete question responses and trends.
Learn more about how the Gallup Poll Social Series works.