Story Highlights
- 41% of U.S. adults are satisfied with immigration levels
- Majorities of Republicans, conservatives want immigration reduced
- Whites more than twice as likely as nonwhites to support less immigration
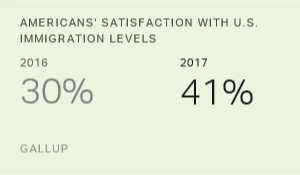
WASHINGTON, D.C. -- Forty-one percent of Americans are satisfied with the current level of immigration into the country, a higher percentage than at any time since Gallup began tracking this issue in 2001.
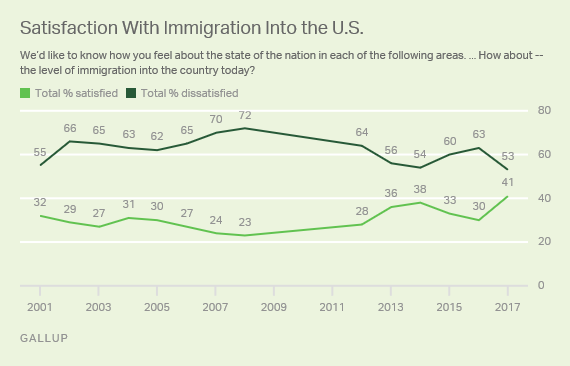
Satisfaction with the immigration level has fluctuated over the past decade, declining through most of the George W. Bush administration to a low of 23% in 2008. It rose again after Barack Obama took office to its previous high of 38% in 2014, before it dipped again. Satisfaction with the immigration level rose 11 percentage points in the past year to reach the new high.
While Americans' satisfaction with the immigration level is at a record high, a majority (53%) remain dissatisfied. Americans' dissatisfaction on the issue is rooted mostly in the desire for less immigration into the country, as it has been consistently over time. A follow-up question asked of those dissatisfied with current immigration levels shows:
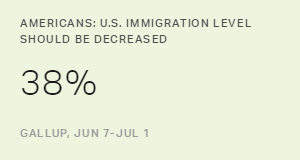
- 36% of U.S. adults are dissatisfied with immigration and want less of it.
- 5% are dissatisfied and want more of it.
- 12% are dissatisfied but want immigration levels to remain the same.
In the last year, the percentage dissatisfied and wanting less immigration fell from 43% to 36%.
These data are based on Gallup's annual Mood of the Nation poll, conducted each January since 2001, except for 2009-2011. The most recent poll was conducted Jan. 4-8.
Democrats, Liberals, Nonwhites Most Satisfied With Immigration Level
Satisfaction with immigration into the country varies widely by political party and ideology. While 65% of Democrats are satisfied with the immigration level, 19% of Republicans are satisfied. Satisfaction increased in the last year among all party affiliations but was most pronounced among Democrats and independents, both of whom saw double-digit increases.
When probed about the nature of their dissatisfaction, 62% of all Republicans say it is based on a desire for less immigration -- by far the dominant view among this group. That compares with 35% of independents and 8% of Democrats. Fewer Democrats and independents desire less immigration than was the case last year, while Republicans' views held steady.
| 2016 | 2017 | Change | |||||||||||||||||||||||||||||||||||||||||||||||||||||||||||||||||||||||||||||||||||||||||||||||||
|---|---|---|---|---|---|---|---|---|---|---|---|---|---|---|---|---|---|---|---|---|---|---|---|---|---|---|---|---|---|---|---|---|---|---|---|---|---|---|---|---|---|---|---|---|---|---|---|---|---|---|---|---|---|---|---|---|---|---|---|---|---|---|---|---|---|---|---|---|---|---|---|---|---|---|---|---|---|---|---|---|---|---|---|---|---|---|---|---|---|---|---|---|---|---|---|---|---|---|---|
| % | % | pct. pts. | |||||||||||||||||||||||||||||||||||||||||||||||||||||||||||||||||||||||||||||||||||||||||||||||||
| Republicans | 13 | 19 | +6 | ||||||||||||||||||||||||||||||||||||||||||||||||||||||||||||||||||||||||||||||||||||||||||||||||
| Independents | 29 | 40 | +11 | ||||||||||||||||||||||||||||||||||||||||||||||||||||||||||||||||||||||||||||||||||||||||||||||||
| Democrats | 48 | 65 | +17 | ||||||||||||||||||||||||||||||||||||||||||||||||||||||||||||||||||||||||||||||||||||||||||||||||
| Conservatives | 13 | 23 | +10 | ||||||||||||||||||||||||||||||||||||||||||||||||||||||||||||||||||||||||||||||||||||||||||||||||
| Moderates | 32 | 45 | +13 | ||||||||||||||||||||||||||||||||||||||||||||||||||||||||||||||||||||||||||||||||||||||||||||||||
| Liberals | 53 | 60 | +7 | ||||||||||||||||||||||||||||||||||||||||||||||||||||||||||||||||||||||||||||||||||||||||||||||||
| Non-Hispanic whites | 25 | 36 | +11 | ||||||||||||||||||||||||||||||||||||||||||||||||||||||||||||||||||||||||||||||||||||||||||||||||
| Nonwhites | 42 | 52 | +10 | ||||||||||||||||||||||||||||||||||||||||||||||||||||||||||||||||||||||||||||||||||||||||||||||||
| Gallup | |||||||||||||||||||||||||||||||||||||||||||||||||||||||||||||||||||||||||||||||||||||||||||||||||||
The patterns by political ideology are somewhat different from those by party affiliation. Moderates saw the largest increase (13 points) in satisfaction over the last year, rising from 32% to 45%. That compares with a 10-point increase among conservatives and a seven-point increase among liberals.
A majority of conservatives (56%), compared with 30% of moderates and 15% of liberals, want less immigration into the country.
The majority of nonwhite Americans (52%) are satisfied with the level of immigration, while a larger majority of their white counterparts (58%) are dissatisfied. Relatedly, whites are more than twice as likely as nonwhites to prefer less immigration (44% vs. 18%, respectively).
Implications
President-elect Donald Trump and the Republican Congress have vowed to move forward on building a border wall with Mexico in an effort to reduce illegal immigration. Trump's broader immigration vision, as outlined in his campaign literature, focuses on increased legal immigration controls designed to make sure American citizens get first priority for jobs.
These findings demonstrate that garnering public support for efforts to substantially change immigration policy may be complicated. While 36% of Americans support a reduction in immigration, 41% -- the largest percentage since 2001 -- say they are satisfied with current levels. Additionally, prior Gallup research shows that large majorities of Americans oppose building a border wall and deporting illegal immigrants.
It is possible that some of the higher satisfaction this year is a result of support for Trump's proposed changes to immigration policy. Conservatives did see a particularly large uptick in satisfaction with immigration, but the increase was more modest among Republicans.
Overall, however, the data demonstrate a sharp divide among Americans on the issue of reducing immigration. Republicans, conservatives and white adults largely drive the support for reducing the immigration level. While building a wall on the Mexican border and reducing immigration will likely be popular with Trump's voter base, it may not be a policy that helps to expand his appeal beyond his core supporters.
Historical data are available in Gallup Analytics.
Survey Methods
Results for this Gallup poll are based on telephone interviews conducted Jan. 4-8, 2017, with a random sample of 1,032 adults, aged 18 and older, living in all 50 U.S. states and the District of Columbia. For results based on the total sample of national adults, the margin of sampling error is ±4 percentage points at the 95% confidence level. All reported margins of sampling error include computed design effects for weighting.
Each sample of national adults includes a minimum quota of 70% cellphone respondents and 30% landline respondents, with additional minimum quotas by time zone within region. Landline and cellular telephone numbers are selected using random-digit-dial methods.
Learn more about how the Gallup Poll Social Series works.