Story Highlights
- 56% say Trump is performing about as they expected
- Nearly one in four say he is doing worse than they expected
- More think he will improve than worsen on the job
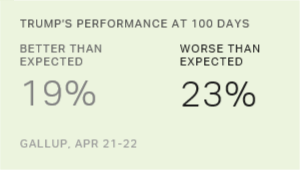
WASHINGTON, D.C. -- As President Donald Trump nears his 100th day in office, a slight majority of Americans (56%) say his performance in office so far has been about what they expected. The rest are closely split between saying he has done worse (23%) versus better (19%) than they expected.
| Better than expected | Worse than expected | As expected | Other/No opinion | ||||||||||||||||||||||||||||||||||||||||||||||||||||||||||||||||||||||||||||||||||||||||||||||||
|---|---|---|---|---|---|---|---|---|---|---|---|---|---|---|---|---|---|---|---|---|---|---|---|---|---|---|---|---|---|---|---|---|---|---|---|---|---|---|---|---|---|---|---|---|---|---|---|---|---|---|---|---|---|---|---|---|---|---|---|---|---|---|---|---|---|---|---|---|---|---|---|---|---|---|---|---|---|---|---|---|---|---|---|---|---|---|---|---|---|---|---|---|---|---|---|---|---|---|---|
| % | % | % | % | ||||||||||||||||||||||||||||||||||||||||||||||||||||||||||||||||||||||||||||||||||||||||||||||||
| U.S. adults | 19 | 23 | 56 | 3 | |||||||||||||||||||||||||||||||||||||||||||||||||||||||||||||||||||||||||||||||||||||||||||||||
| Republicans | 37 | 5 | 57 | 1 | |||||||||||||||||||||||||||||||||||||||||||||||||||||||||||||||||||||||||||||||||||||||||||||||
| Independents | 18 | 25 | 53 | 4 | |||||||||||||||||||||||||||||||||||||||||||||||||||||||||||||||||||||||||||||||||||||||||||||||
| Democrats | 4 | 38 | 57 | 1 | |||||||||||||||||||||||||||||||||||||||||||||||||||||||||||||||||||||||||||||||||||||||||||||||
| Gallup, April 21-22, 2017 | |||||||||||||||||||||||||||||||||||||||||||||||||||||||||||||||||||||||||||||||||||||||||||||||||||
Majorities of Republicans, Democrats and independents say that Trump is meeting their expectations -- although that is clearly not a positive statement from Democrats, most of whom disapprove of the job Trump is doing.
There is a strong relationship between Americans' views of Trump's overall job performance as president and whether he is meeting their expectations.
- Most of those who approve of Trump's handling of his job as president say he is doing about as they expected (56%) or better (41%). Only 2% say he is doing worse.
- Most of those who disapprove of Trump's job performance say he is doing about as they expected (54%) or worse (41%). Four percent of this group say he is doing better.
| Approve | Disapprove | ||||||||||||||||||||||||||||||||||||||||||||||||||||||||||||||||||||||||||||||||||||||||||||||||||
|---|---|---|---|---|---|---|---|---|---|---|---|---|---|---|---|---|---|---|---|---|---|---|---|---|---|---|---|---|---|---|---|---|---|---|---|---|---|---|---|---|---|---|---|---|---|---|---|---|---|---|---|---|---|---|---|---|---|---|---|---|---|---|---|---|---|---|---|---|---|---|---|---|---|---|---|---|---|---|---|---|---|---|---|---|---|---|---|---|---|---|---|---|---|---|---|---|---|---|---|
| % | % | ||||||||||||||||||||||||||||||||||||||||||||||||||||||||||||||||||||||||||||||||||||||||||||||||||
| Better than expected | 41 | 4 | |||||||||||||||||||||||||||||||||||||||||||||||||||||||||||||||||||||||||||||||||||||||||||||||||
| About as expected | 56 | 54 | |||||||||||||||||||||||||||||||||||||||||||||||||||||||||||||||||||||||||||||||||||||||||||||||||
| Worse than expected | 2 | 41 | |||||||||||||||||||||||||||||||||||||||||||||||||||||||||||||||||||||||||||||||||||||||||||||||||
| No opinion | 1 | 1 | |||||||||||||||||||||||||||||||||||||||||||||||||||||||||||||||||||||||||||||||||||||||||||||||||
| Gallup, April 21-22, 2017 | |||||||||||||||||||||||||||||||||||||||||||||||||||||||||||||||||||||||||||||||||||||||||||||||||||
These findings are based on a Gallup poll conducted April 21-22. Americans' broad evaluation of Trump's presidency is in line with how they viewed Barack Obama and Bill Clinton at the 100-day mark in their first term. Majorities of Americans said each of these then-new presidents were performing about as they thought they would.
On the margins, Americans' 100-day assessment of Obama tilted positive, with 24% saying he was doing a better job than they anticipated and only 13% saying worse. Ratings of Clinton split evenly at 12% better and 14% worse. More Americans today say Trump is doing worse than they expected (23%) than said this for either Obama (13%) or Clinton (14%).
Public Expects Trump's Effectiveness to Change
Americans offer a bit more positive forecast for Trump's future performance. Thirty-nine percent predict Trump will become more effective in office than he is now, whereas 34% think he will become less effective. Just under a quarter think his effectiveness will remain the same.
Working in Trump's favor -- and perhaps reflecting Senate Majority Leader Mitch McConnell's view that Trump is "learning the job" -- 74% of Republicans believe Trump will become more effective. That slightly eclipses the 65% of Democrats who think he will become less effective. Also, independents offer a net-positive outlook, with 37% predicting he will become more effective and 31% less effective.
| More effective | Remain as now | Less effective | No opinion | ||||||||||||||||||||||||||||||||||||||||||||||||||||||||||||||||||||||||||||||||||||||||||||||||
|---|---|---|---|---|---|---|---|---|---|---|---|---|---|---|---|---|---|---|---|---|---|---|---|---|---|---|---|---|---|---|---|---|---|---|---|---|---|---|---|---|---|---|---|---|---|---|---|---|---|---|---|---|---|---|---|---|---|---|---|---|---|---|---|---|---|---|---|---|---|---|---|---|---|---|---|---|---|---|---|---|---|---|---|---|---|---|---|---|---|---|---|---|---|---|---|---|---|---|---|
| % | % | % | % | ||||||||||||||||||||||||||||||||||||||||||||||||||||||||||||||||||||||||||||||||||||||||||||||||
| U.S. adults | 39 | 22 | 34 | 5 | |||||||||||||||||||||||||||||||||||||||||||||||||||||||||||||||||||||||||||||||||||||||||||||||
| Republicans | 74 | 17 | 8 | 2 | |||||||||||||||||||||||||||||||||||||||||||||||||||||||||||||||||||||||||||||||||||||||||||||||
| Independents | 37 | 24 | 31 | 7 | |||||||||||||||||||||||||||||||||||||||||||||||||||||||||||||||||||||||||||||||||||||||||||||||
| Democrats | 11 | 21 | 65 | 3 | |||||||||||||||||||||||||||||||||||||||||||||||||||||||||||||||||||||||||||||||||||||||||||||||
| Gallup, April 21-22, 2017 | |||||||||||||||||||||||||||||||||||||||||||||||||||||||||||||||||||||||||||||||||||||||||||||||||||
Two in Three Accept Trump as Legitimate
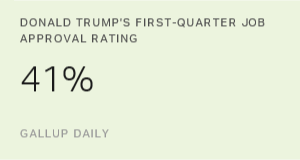
Trump's job approval rating has been net-negative since day one. In Gallup's latest three-day rolling average, 56% disapprove and 39% approve of the overall job he is doing.
Despite majority disapproval, 66% of Americans say they accept Trump as a legitimate president, while 32% do not. Some have questioned Trump's legitimacy due to his loss to Hillary Clinton in the popular vote, questions about Russian interference in the campaign and his personal temperament.
Those who don't consider Trump a legitimate president are split in their reasoning: 38% say it's because of who Trump is as a person, whereas 33% say it's because of how Trump won the election. Another 24% of his detractors say both factors contribute to their opinion.
| Yes, accept | No, not accept | No opinion | |||||||||||||||||||||||||||||||||||||||||||||||||||||||||||||||||||||||||||||||||||||||||||||||||
|---|---|---|---|---|---|---|---|---|---|---|---|---|---|---|---|---|---|---|---|---|---|---|---|---|---|---|---|---|---|---|---|---|---|---|---|---|---|---|---|---|---|---|---|---|---|---|---|---|---|---|---|---|---|---|---|---|---|---|---|---|---|---|---|---|---|---|---|---|---|---|---|---|---|---|---|---|---|---|---|---|---|---|---|---|---|---|---|---|---|---|---|---|---|---|---|---|---|---|---|
| % | % | % | |||||||||||||||||||||||||||||||||||||||||||||||||||||||||||||||||||||||||||||||||||||||||||||||||
| U.S. adults | 66 | 32 | 2 | ||||||||||||||||||||||||||||||||||||||||||||||||||||||||||||||||||||||||||||||||||||||||||||||||
| Republicans | 93 | 6 | 1 | ||||||||||||||||||||||||||||||||||||||||||||||||||||||||||||||||||||||||||||||||||||||||||||||||
| Independents | 68 | 30 | 2 | ||||||||||||||||||||||||||||||||||||||||||||||||||||||||||||||||||||||||||||||||||||||||||||||||
| Democrats | 41 | 56 | 3 | ||||||||||||||||||||||||||||||||||||||||||||||||||||||||||||||||||||||||||||||||||||||||||||||||
| Gallup, April 21-22, 2017 | |||||||||||||||||||||||||||||||||||||||||||||||||||||||||||||||||||||||||||||||||||||||||||||||||||
Bottom Line
Trump's performance as president is not surprising to the majority of Americans. For better or worse, the majority are getting what they expected. And that is similar to reactions to the past two presidents at this point in their presidency. These views are highly partisan, however, so saying Trump is meeting expectations is far from an endorsement across all parties.
Americans are a bit more hopeful about Trump's future leadership, mainly because a small percentage of Democrats are willing to join most Republicans in saying Trump's effectiveness will improve as he spends more time in office. Trump recently called the 100-day marker a "ridiculous standard" for judging presidents, suggesting he, too, believes his presidency will get better.
Historical data are available in Gallup Analytics.
Survey Methods
Results for this Gallup poll are based on telephone interviews conducted April, 21-22, 2017, on the Gallup U.S. Daily survey, with a random sample of 1,024 adults, aged 18 and older, living in all 50 U.S. states and the District of Columbia. For results based on the total sample of national adults, the margin of sampling error is ±4 percentage points at the 95% confidence level. All reported margins of sampling error include computed design effects for weighting.
Each sample of national adults includes a minimum quota of 70% cellphone respondents and 30% landline respondents, with additional minimum quotas by time zone within region. Landline and cellular telephone numbers are selected using random-digit-dial methods.
View survey methodology, complete question responses and trends.
Learn more about how the Gallup U.S. Daily works.