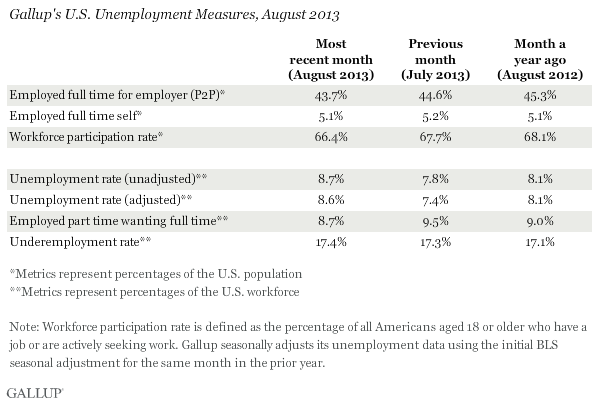
WASHINGTON, D.C. -- The U.S. Payroll to Population employment rate (P2P), as measured by Gallup, dropped to 43.7% in August, from 44.6% in July, and is down from 45.3% in August 2012.
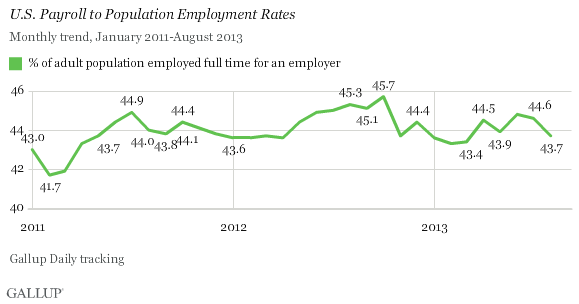
Gallup's P2P metric estimates the percentage of the U.S. adult population aged 18 and older who are employed full time by an employer for at least 30 hours per week. P2P is not seasonally adjusted.
These results are based on Gallup Daily tracking interviews with approximately 31,000 Americans conducted Aug. 1-31 by landline and cellphone. Gallup does not count adults who are self-employed, working part time, unemployed, or out of the workforce as payroll-employed in the P2P metric.
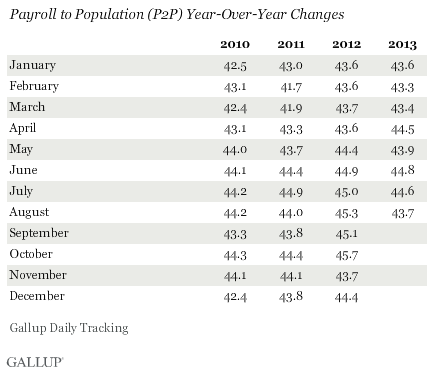
Despite the August decline, the P2P rate is still higher than it was in the first three months of the year, when it averaged 43.4%. However, P2P is traditionally stronger in the summer, because of seasonal increases in hiring, such as in the farming and agriculture sectors. Because of this, comparing year-over-year changes is helpful in evaluating whether monthly changes are due to seasonality or true growth (or deterioration) in the percentage of people working full time for an employer.
August marks the seventh month this year that the P2P rate failed to improve over the same month in 2012. In fact, so far this year, P2P has declined an average of 0.3 percentage points in terms of monthly year-over-year changes. That is a reversal from last year, when 11 out of 12 months showed year-over-year increases in P2P and there was an average 0.8-point increase for the year.
Another measure of the job market, Gallup's Job Creation Index, was stable in August, which suggests that workers aren't seeing more layoffs than in previous months and that additional employer cuts did not lead to the decline in P2P. Rather, together, these metrics indicate that people may be retiring or leaving the workforce.
Unemployment Rises to 8.7% in August
Unlike Gallup's P2P rate, which is a percentage of the total population, traditional employment metrics, such as the unemployment rates Gallup and the U.S. Bureau of Labor Statistics report, are based on a percentage of the workforce. Gallup defines the "workforce" as adults who are working or actively looking for work and available for employment.
The U.S. workforce participation rate in August was 66.4%, a decline from 67.7% in July, and down from 68.1% in August 2012.
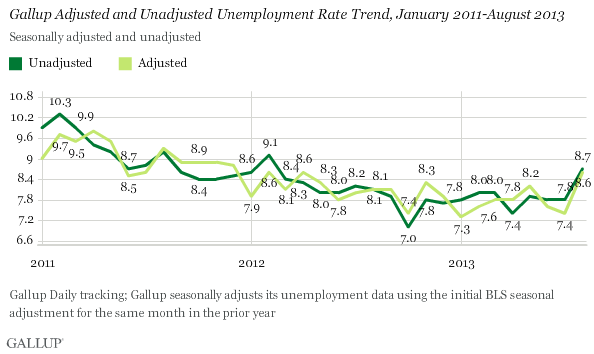
Gallup's unadjusted unemployment rate for the U.S. workforce was 8.7% in August, up from 7.8% in July and from 8.1% in August 2012. Similar to P2P, unemployment fluctuates seasonally, and the year-over-year change is the most informative comparison. The uptick in unemployment this August compared with August of last year is the first year-over-year increase since Gallup was able to begin tracking yearly changes in 2011.
The increase is partly due to the decline in the size of the workforce. Because the unemployment rate is based on the size of the workforce, if people drop out of the workforce but the number of unemployed remains relatively flat, the unemployment rate will actually increase, even though the same number of people are unemployed. This is at least partly responsible for the increase in August's rate, though some of the jump is a true increase. When looking at the population as a whole, in August 5.8% of the population was unemployed, compared with 5.3% in July and 5.5% August 2012.
Gallup's seasonally adjusted U.S. unemployment rate for August was 8.6%, up from 7.4% in July. Gallup calculates this rate by applying the adjustment factor the government used for the same month in the previous year. Last year, the government did not make an initial adjustment to August's rate, but adjusted July's down by 0.4 points, which partly accounts for the increase in seasonally adjusted unemployment.
Underemployment, as measured without seasonal adjustment, was 17.4% in August, essentially unchanged from July (17.3%), but up slightly over August 2012 (17.1%).
Gallup's U.S. underemployment rate combines the percentage of adults in the workforce who are unemployed with the percentage of those who are working part time but looking for full-time work.
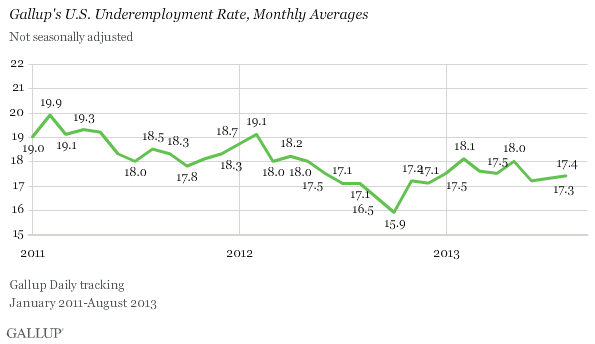
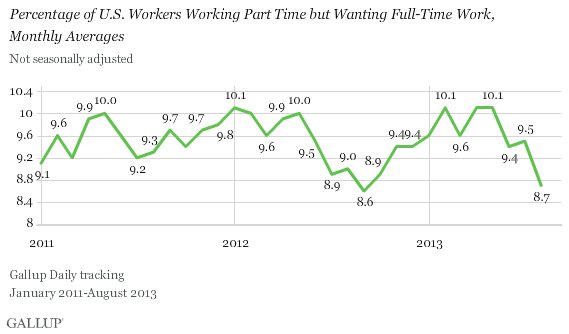
The percentage of part-time workers wanting full-time work was 8.7% August, down from 9.5% in July. This explains why underemployment remained flat despite the rise in unemployment. The percentage of part-time workers looking for full-time work is at the lowest level so far this year.
Bottom Line
Gallup's seasonally adjusted U.S. unemployment rate -- the closest comparison it has to the official numbers released by the BLS -- increased in August. The BLS is not likely to report a decrease in unemployment when the numbers are released on Friday, and may even report a slight increase.
However, it is important to note that Gallup's adjusted number is based on past seasonal adjustments made by the BLS, and that this year's BLS adjustments may not be the same when the government releases its number. Additionally, while both Gallup and BLS numbers are based on robust surveys, there are important methodological differences between the two. Thus, although Gallup's employment numbers are highly correlated with BLS rates, Gallup's numbers tend to have more month-to-month variability, and the unemployment rate as reported by the BLS each month does not always track precisely with the Gallup estimate.
The decline in the workforce, combined with the drop in P2P and increase in unemployment, indicates that little job growth occurred last month over August 2012. Unemployment rates, which are based on the workforce, can actually decline if unemployed people become frustrated with the job search and drop out of the workforce. This decline in unemployment masks a lack of job growth, and makes the employment situation appear to be improving when in fact little has changed. Many economists have attributed recent improvements in unemployment partly to a shrinking workforce rather than true job growth.
Alternatively, if people drop out of the workforce but the net number of unemployed remains the same (or increases), the unemployment rate will increase. This seems to be what happened last month. A decline in the workforce, combined with a 0.5-point increase in the percentage of the population that is unemployed, led to a large increase in the unemployment rate.
This is why P2P paints a more straightforward picture of the nation's jobs situation. The P2P rate can't artificially improve or deteriorate as people move in and out of the workforce. The decline in P2P in August, and the lack of growth in P2P in 2013 as a whole, is a sign that employers are not adding jobs at the pace seen in 2012. Additional jobs will need to be added to sustain the improvements made in late 2012.
Early indications for September are that it may post more promising employment numbers than August. Unemployment has already begun to decline during the first few days of the month. Gallup will continue to monitor the employment situation and update the rate daily.
Survey Methods
Results for this Gallup poll are based on telephone interviews conducted Aug. 1-31, 2013, on the Gallup Daily tracking survey, with a random sample of 31,530 adults, aged 18 and older, living in all 50 U.S. states and the District of Columbia.
For results based on the total sample of national adults, one can say with 95% confidence that the margin of sampling error is ±1 percentage point.
Interviews are conducted with respondents on landline telephones and cellular phones, with interviews conducted in Spanish for respondents who are primarily Spanish-speaking. Each sample of national adults includes a minimum quota of 50% cellphone respondents and 50% landline respondents, with additional minimum quotas by region. Landline and cell telephone numbers are selected using random-digit-dial methods. Landline respondents are chosen at random within each household on the basis of which member had the most recent birthday.
Samples are weighted to correct for unequal selection probability, nonresponse, and double coverage of landline and cell users in the two sampling frames. They are also weighted to match the national demographics of gender, age, race, Hispanic ethnicity, education, region, population density, and phone status (cellphone only/landline only/both, and cellphone mostly). Demographic weighting targets are based on the March 2012 Current Population Survey figures for the aged 18 and older U.S. population. Phone status targets are based on the July-December 2011 National Health Interview Survey. Population density targets are based on the 2010 census. All reported margins of sampling error include the computed design effects for weighting.
In addition to sampling error, question wording and practical difficulties in conducting surveys can introduce error or bias into the findings of public opinion polls.
For more details on Gallup's polling methodology, visit www.gallup.com.
