PRINCETON, NJ -- Forty-two percent of Americans, on average, identified as political independents in 2013, the highest Gallup has measured since it began conducting interviews by telephone 25 years ago. Meanwhile, Republican identification fell to 25%, the lowest over that time span. At 31%, Democratic identification is unchanged from the last four years but down from 36% in 2008.

The results are based on more than 18,000 interviews with Americans from 13 separate Gallup multiple-day polls conducted in 2013.
In each of the last three years, at least 40% of Americans have identified as independents. These are also the only years in Gallup's records that the percentage of independents has reached that level.
Americans' increasing shift to independent status has come more at the expense of the Republican Party than the Democratic Party. Republican identification peaked at 34% in 2004, the year George W. Bush won a second term in office. Since then, it has fallen nine percentage points, with most of that decline coming during Bush's troubled second term. When he left office, Republican identification was down to 28%. It has declined or stagnated since then, improving only slightly to 29% in 2010, the year Republicans "shellacked" Democrats in the midterm elections.
Not since 1983, when Gallup was still conducting interviews face to face, has a lower percentage of Americans, 24%, identified as Republicans than is the case now. That year, President Ronald Reagan remained unpopular as the economy struggled to emerge from recession. By the following year, amid an improving economy and re-election for the increasingly popular incumbent president, Republican identification jumped to 30%, a level generally maintained until 2007.
Democratic identification has also declined in recent years, falling five points from its recent high of 36% in 2008, the year President Barack Obama was elected. The current 31% of Americans identifying as Democrats matches the lowest annual average in the last 25 years.
Fourth Quarter Surge in Independence
The percentage of Americans identifying as independents grew over the course of 2013, surging to 46% in the fourth quarter. That coincided with the partial government shutdown in October and the problematic rollout of major provisions of the healthcare law, commonly known as "Obamacare."
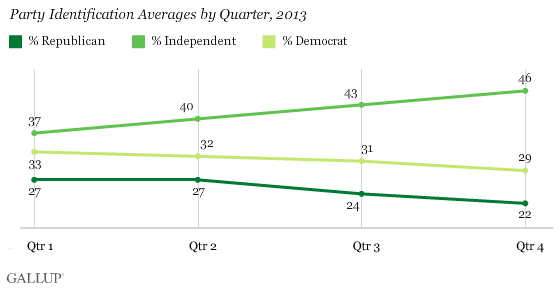
The 46% independent identification in the fourth quarter is a full three percentage points higher than Gallup has measured in any quarter during its telephone polling era.
Democrats Maintain Edge in Party Identification
Democrats maintain their six-point edge in party identification when independents' "partisan leanings" are taken into account. In addition to the 31% of Americans who identify as Democrats, another 16% initially say they are independents but when probed say they lean to the Democratic Party. An equivalent percentage, 16%, say they are independent but lean to the Republican Party, on top of the 25% of Americans identifying as Republicans. All told, then, 47% of Americans identify as Democrats or lean to the Democratic Party, and 41% identify as Republicans or lean to the Republican Party.
Democrats have held at least a nominal advantage on this measure of party affiliation in all but three years since Gallup began asking the "partisan lean" follow-up in 1991. During this time, Democrats' advantage has been as high as 12 points, in 2008. However, that lead virtually disappeared by 2010, although Democrats have re-established an edge in the last two years.

Implications
Americans are increasingly declaring independence from the political parties. It is not uncommon for the percentage of independents to rise in a non-election year, as 2013 was. Still, the general trend in recent years, including the 2012 election year, has been toward greater percentages of Americans identifying with neither the Republican Party nor the Democratic Party, although most still admit to leaning toward one of the parties.
The rise in political independence is likely an outgrowth of Americans' record or near-record negative views of the two major U.S. parties, of Congress, and their low level of trust in government more generally.
The increased independence adds a greater level of unpredictability to this year's congressional midterm elections. Because U.S. voters are less anchored to the parties than ever before, it's not clear what kind of appeals may be most effective to winning votes. But with Americans increasingly eschewing party labels for themselves, candidates who are less closely aligned to their party or its prevailing doctrine may benefit.
Survey Methods
Results are based on aggregated telephone interviews from 13 separate Gallup polls conducted in 2013, with a random sample of 18,871 adults, aged 18 and older, living in all 50 U.S. states and the District of Columbia.
For results based on the total sample of national adults, the margin of sampling error is ±1 percentage point at the 95% confidence level.
Interviews are conducted with respondents on landline telephones and cellular phones, with interviews conducted in Spanish for respondents who are primarily Spanish-speaking. Each sample of national adults includes a minimum quota of 50% cellphone respondents and 50% landline respondents, with additional minimum quotas by region. Landline and cell telephone numbers are selected using random-digit-dial methods. Landline respondents are chosen at random within each household on the basis of which member had the most recent birthday.
Samples are weighted to correct for unequal selection probability, nonresponse, and double coverage of landline and cell users in the two sampling frames. They are also weighted to match the national demographics of gender, age, race, Hispanic ethnicity, education, region, population density, and phone status (cellphone only/landline only/both, and cellphone mostly). Demographic weighting targets are based on the March 2012 Current Population Survey figures for the aged 18 and older U.S. population. Phone status targets are based on the July-December 2011 National Health Interview Survey. Population density targets are based on the 2010 census. All reported margins of sampling error include the computed design effects for weighting.
In addition to sampling error, question wording and practical difficulties in conducting surveys can introduce error or bias into the findings of public opinion polls.
For more details on Gallup's polling methodology, visit www.gallup.com.