PRINCETON, NJ -- Blue states outnumbered red states in the U.S. last year, 17 to 14, according to Gallup Daily tracking of party preferences. That three-state advantage for the Democrats is down from a seven-state lead for the Democrats in 2012, and well short of their 30-state lead in 2008 -- Gallup's first year of state measurement. Still, it's larger than the near-tie in the party balance of states found in 2011.
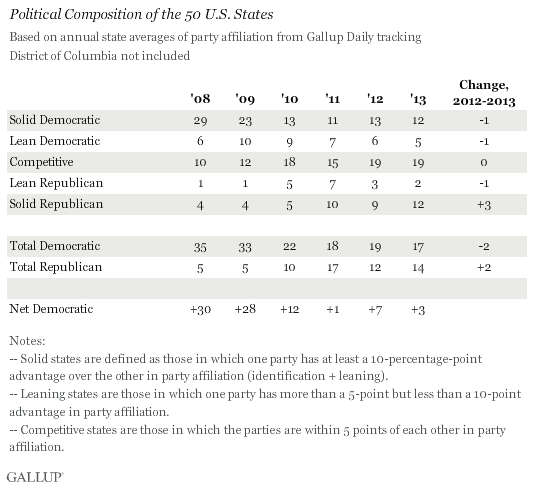
The biggest change in the party profile of the states in 2013 was the Republicans' gain of three solidly Republican states -- meaning those where Republicans outnumbered Democrats by at least 10 percentage points. Those additions were South Carolina, South Dakota, and Oklahoma. However, this was partly offset by a net loss of one Republican-leaning state. At the same time, Democrats had net losses of one solid and one Democratic-leaning state, while the number of competitive states was unchanged.
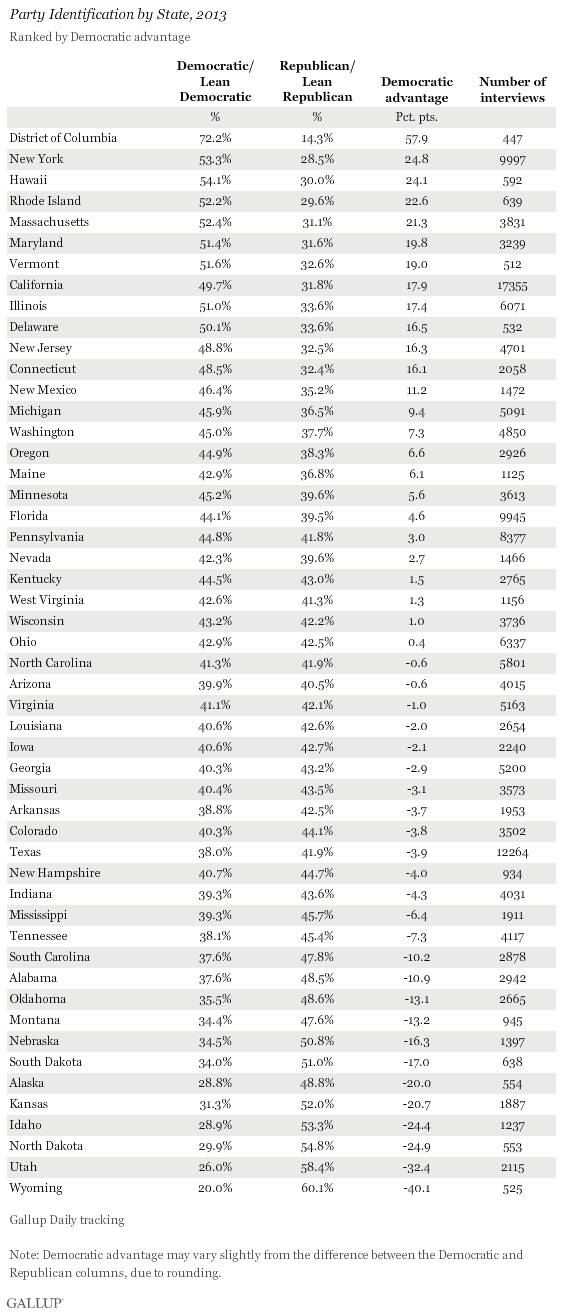
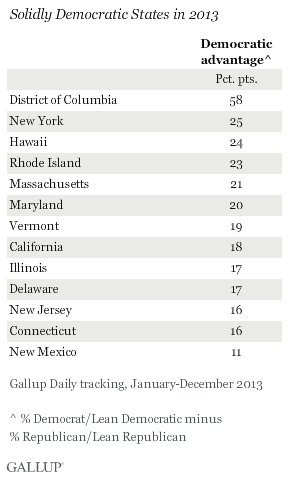
Overall, the most Democratic-leaning states in 2013 were New York, Hawaii, Rhode Island, Massachusetts, and Maryland, all showing 20-point or better Democratic advantages in party identification. Gallup considers another seven states to be "solidly Democratic," by virtue of their 10-point or better Democratic advantage.
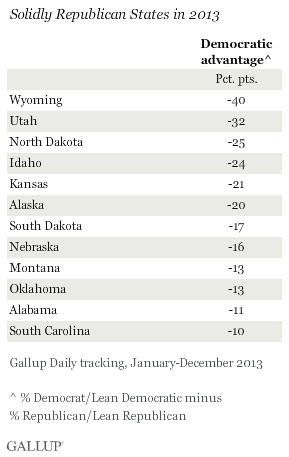
The most Republican-leaning states were Wyoming, Utah, North Dakota, Idaho, Kansas, and Alaska, all with 20-point or more Democratic deficits. Another six states qualify as solidly Republican, with Democratic deficits ranging from -10 to -17. Complete results for party ID by state are found on page 2.
 |
| Explore complete state data > |
The results are from Gallup Daily tracking from January through December 2013, and are based on interviews with more than 178,000 U.S. adults, with each state's data weighted to match U.S. Census demographic parameters for that state's adult population. The state sample sizes range from 447 for the District of Columbia to 17,355 for California. All but the District of Columbia have at least 500 respondents, and 40 states have at least 1,000.
Gallup determines the party orientation of each state by subtracting the total percentage of adults identifying as or leaning Republican from those identifying as Democrats or leaning Democratic, thus creating a "Democratic advantage" figure. Positive values indicate a state is more Democratic than Republican, while negative values indicate it is more Republican than Democratic. Taking the partisan leanings of independents into account gives a better picture of the parties' relative strength in each state, as independents who lean toward a particular party typically vote for that party's candidates. Additionally, the percentage of total independents (before leaners are allocated to the parties) varies widely by state, from 30% in Kentucky to 55% in New Hampshire, which may mask latent partisanship.
Red States Hang Together; Blue States Rim the Coasts
Republican states are clustered in the center of the country stretching west to the Rockies, with another bundle located in the Southeast. Democratic states are more dispersed, although largely grouped along the East and West Coasts, as well as around the Great Lakes.
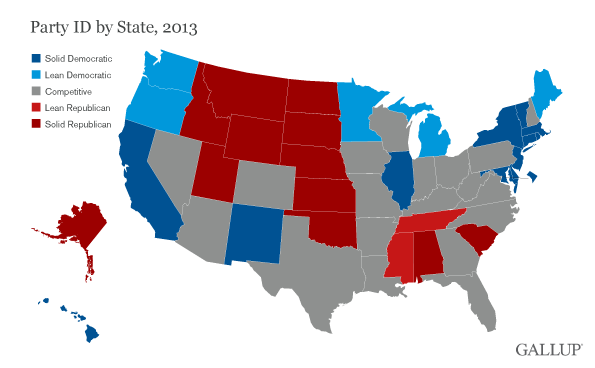
As seen in 2012, only a handful of states share a border with a state oriented to the opposing party, underscoring the extreme regional separation of the parties. The Democratic states of Oregon and Washington share a border with Republican Idaho, and the Republican Dakotas border Democratic-leaning Minnesota. Democratic New Mexico barely touches Republican Utah on its northwest corner and the panhandle of Oklahoma on its northeast corner.
Despite the Republicans' gain in the states last year, the overall political orientation of the country stayed about the same in 2013, with the Democrats enjoying a six-point advantage -- 47% vs. 41% -- over Republicans. That compares with a five-point advantage -- 47% vs. 42% -- in 2012. Part of the reason for this seeming discrepancy is that some of the Democratic Party's largest gains last year were in highly populous states, and ones where the Democrats already held a strong lead. They gained three points each in California, New Jersey, and New York, and one point in Illinois. Thus, while helping to increase Democratic ID nationally, these gains did not add to the number of Democratic states.
Implications
Leading up to the 2014 midterm elections, when 36 Senate seats and 36 governorships will be on the line, Gallup's 2013 polling saw the Republican Party making slight gains in the party orientation of the states, with three more states now in the GOP's column than in 2012. That modest shift still leaves Democratic states outnumbering Republican states. But it reflects a gradual shrinking of the Democrats' dominance since 2008, the year Barack Obama first won the presidency.
The resulting four-state lead for Democrats in 2013 is far less than their 12-state lead in 2010 -- a year with a wave election that swept out 63 House Democrats and established the current Republican majority. In that same vein, Democrats appear disadvantaged in protecting this year's Senate majority, as they will be attempting to protect seats in three solidly Republican states (South Dakota, Montana, and Alaska), as well as in a host of truly competitive states. Thus, the political climate appears relatively auspicious for Republicans. But given potential differences in partisanship between the state adult population and the voting electorate, state partisanship doesn't always match state voting patterns, and doesn't account for the influence of incumbency or specific issues in a given race.
Further, to the extent state partisanship is instructive in forecasting how statewide elections play out, it remains to be seen how the 2013 patterns might change in 2014. The elections will be held more than 10 months into the year, and more than a year after most of the 2013 data were collected. Of particular note, a major change in Obama's job approval rating by this fall could affect party ID nationally, could trickle down to state partisanship figures, and potentially affect at least some statewide races.
Gallup's "State of the States" series reveals state-by-state differences on political, economic, and well-being measures Gallup tracks each day. New stories based on full-year 2013 data will be released in the coming months.
Survey Methods
Results for this Gallup poll are based on telephone interviews conducted Jan. 2-Dec. 29, 2013, on the Gallup Daily tracking survey, with a random sample of 178,527 adults, aged 18 and older, living in all 50 U.S. states and the District of Columbia.
For results based on the total sample of national adults, the margin of sampling error is ±1 percentage point at the 95% confidence level.
Margins of error for individual states are no greater than ±6 percentage points, and are ±3 percentage points in most states. The margin of error for the District of Columbia is ±6 percentage points.
Interviews are conducted with respondents on landline telephones and cellular phones, with interviews conducted in Spanish for respondents who are primarily Spanish-speaking. Each sample of national adults includes a minimum quota of 50% cellphone respondents and 50% landline respondents, with additional minimum quotas by time zone within region. Landline and cellular telephone numbers are selected using random-digit-dial methods. Landline respondents are chosen at random within each household on the basis of which member had the most recent birthday.
Samples are weighted to correct for unequal selection probability, nonresponse, and double coverage of landline and cell users in the two sampling frames. They are also weighted to match the national demographics of gender, age, race, Hispanic ethnicity, education, region, population density, and phone status (cellphone only/landline only/both, cellphone mostly, and having an unlisted landline number). Demographic weighting targets are based on the most recent Current Population Survey figures for the aged 18 and older U.S. population. Phone status targets are based on the most recent National Health Interview Survey. Population density targets are based on the most recent U.S. census. All reported margins of sampling error include the computed design effects for weighting.
In addition to sampling error, question wording and practical difficulties in conducting surveys can introduce error or bias into the findings of public opinion polls.
For more details on Gallup's polling methodology, visit www.gallup.com.