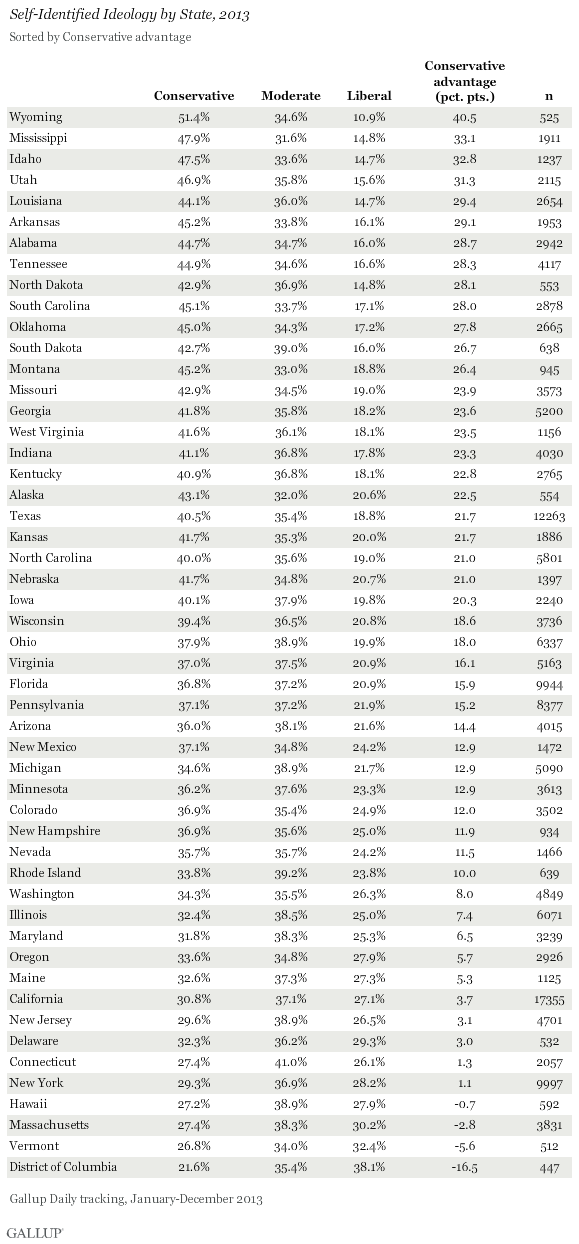
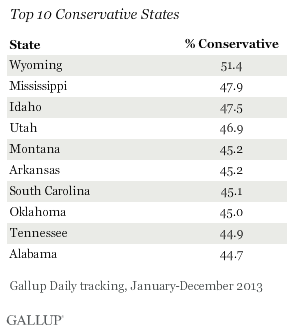
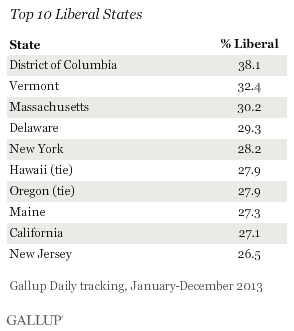
WASHINGTON, D.C. -- Wyoming was the most conservative U.S. state in 2013, replacing Alabama, which fell to 10th place. The District of Columbia was once again the most liberal area in the United States, with Vermont and Massachusetts having the highest percentage of liberals among the 50 states.
 |
| Explore complete state data > |
Overall, Americans were much more likely to self-identify as conservatives than as liberals last year, though that gap shrank from previous years.
The most conservative states are located primarily in the South and West, while the most liberal states are found on the East and West Coasts of the United States, with the exception of Hawaii. The top 10 liberal states all voted for President Barack Obama in 2008 and 2012, while the top 10 conservative states all voted for the Republican nominees -- John McCain and Mitt Romney, respectively -- in those years.
For the most part, the top conservative states align with the most Republican states in the union, and the top liberal states, with the most Democratic areas. Yet Kansas and Nebraska, two of the most solid Republican states, do not fall among the top 10 conservative states. Similarly, the Democratic states of Maryland, Illinois, Connecticut, and New Mexico are not among the top 10 liberal states, but Gallup found that they were among the solid Democratic states in 2013.
Conservative Advantage Still Predominant, Yet Down From 2012
The national "conservative advantage," defined as the percentage of residents self-identifying as conservative minus the percentage self-identifying as liberal in each state, was at 14.6 percentage points in 2013. Given that national advantage, only three states (Hawaii, Massachusetts, and Vermont) have a negative score, along with the District of Columbia, meaning they have more liberals than conservatives.
In 2012, the conservative advantage overall was 15.9 points, suggesting that the gap between conservative and liberal self-identification is narrowing. Full results by state can be found on page 2.
Bottom Line
There may have been more "blue" states than "red" states in 2013, but a clear majority of Americans are ideologically at the center or right of center. How do Democrats continue to win elections if so few Americans identify themselves as liberal? The answer may lie with moderates, which, as a voting bloc, are solidly Democratic. If moderates begin voting with Republicans in the near or long-term future, there may indeed be a Republican revival on the national level.
Yet while less than a quarter of Americans consider themselves ideologically liberal, the term has been steadily increasingly in popularity over a generation. This may be attributable to Americans becoming more comfortable with the term again. Once a popular staple of the civil rights and protest era of the 1960s and 1970s, the term "liberal" was later derided on the national stage -- for example, when George H.W. Bush scornfully used the term against Michael Dukakis in the 1988 presidential election. With the passage of time, perhaps this moniker is experiencing a rebirth of sorts.
Gallup's "State of the States" series reveals state-by-state differences on political, economic, and well-being measures Gallup tracks each day. New stories based on full-year 2013 data will be released in the coming months.
Survey Methods
Results for this Gallup poll are based on telephone interviews conducted Jan. 2-Dec. 29, 2013, on the Gallup Daily tracking survey, with a random sample of 178,527 adults, aged 18 and older, living in all 50 U.S. states and the District of Columbia.
For results based on the total sample of national adults, the margin of sampling error is ±1 percentage point at the 95% confidence level.
Margins of error for individual states are no greater than ±6 percentage points, and are ±3 percentage points in most states. The margin of error for the District of Columbia is ±6 percentage points.
Interviews are conducted with respondents on landline telephones and cellular phones, with interviews conducted in Spanish for respondents who are primarily Spanish-speaking. Each sample of national adults includes a minimum quota of 50% cellphone respondents and 50% landline respondents, with additional minimum quotas by time zone within region. Landline and cellular telephone numbers are selected using random-digit-dial methods. Landline respondents are chosen at random within each household on the basis of which member had the most recent birthday.
Samples are weighted to correct for unequal selection probability, nonresponse, and double coverage of landline and cell users in the two sampling frames. They are also weighted to match the national demographics of gender, age, race, Hispanic ethnicity, education, region, population density, and phone status (cellphone only/landline only/both, cellphone mostly, and having an unlisted landline number). Demographic weighting targets are based on the most recent Current Population Survey figures for the aged 18 and older U.S. population. Phone status targets are based on the most recent National Health Interview Survey. Population density targets are based on the most recent U.S. census. All reported margins of sampling error include the computed design effects for weighting.
In addition to sampling error, question wording and practical difficulties in conducting surveys can introduce error or bias into the findings of public opinion polls.
For more details on Gallup's polling methodology, visit www.gallup.com.