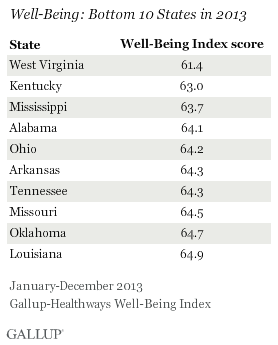
WASHINGTON, D.C. -- North Dakota residents had the highest well-being in the nation in 2013, according to the Gallup-Healthways Well-Being Index. South Dakota trailed its northern neighbor in second place, with its highest score in six years of measurement. Hawaii held the top spot for the previous four years, but fell slightly last year. West Virginia and Kentucky had the two lowest well-being scores, for the fifth year in a row.
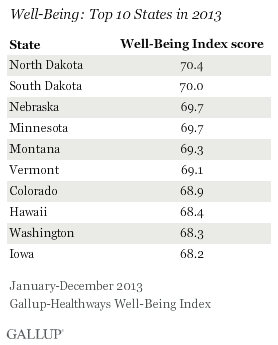
North Dakota rejoined the top 10 well-being states in 2013 after being among that group from 2009 to 2011. South Dakota was among the top 10 in well-being for the first time since 2010, while Washington last appeared in 2008.
 |
| Explore complete state data > |
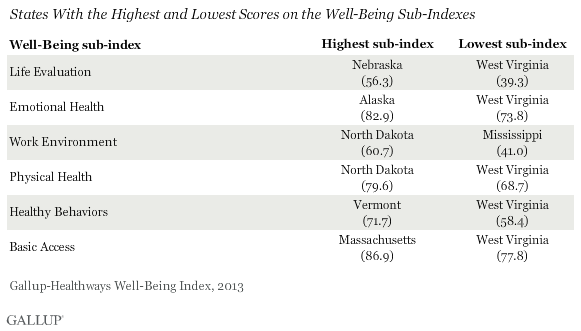
These state-level data are based on more than 178,000 interviews with American adults across all 50 states, conducted from January-December 2013. Gallup and Healthways started tracking state-level well-being in 2008. The Gallup-Healthways Well-Being Index score for the nation and for each state is an average of six sub-indexes, which individually examine life evaluation, emotional health, work environment, physical health, healthy behaviors, and access to basic necessities.
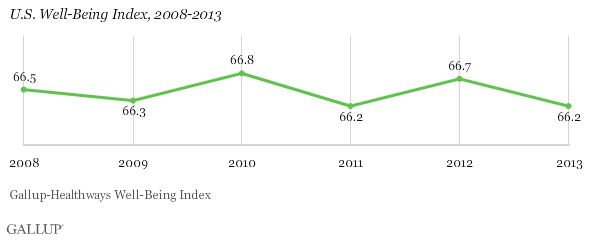
The Well-Being Index is calculated on a scale of 0 to 100, where a score of 100 represents ideal well-being. Well-Being Index scores among states varied within a nine-point range in 2013. The Well-Being Index score for the nation in 2013 dipped to 66.2 from 66.7 in 2012, and matches the previous low, measured in 2011.
Based on U.S. Census Bureau regions, Midwestern and Western states earned nine of the 10 highest well-being scores in 2013, while Southern states had eight of the 10 lowest well-being scores. The regional pattern of well-being is similar to previous years.
West Virginia at the Bottom on Five Out of Six Key Areas of Well-Being
In addition to North Dakota's having the highest overall Well-Being Index score, it was the top state on two of the six well-being sub-indexes: Work Environment and Physical Health. At the opposite end of the spectrum was West Virginia, which ranked last on all sub-indexes except Work Environment.
Nebraska topped all other states on the Life Evaluation Index, with a score that was 17 points higher than West Virginia's. Alaska boasted the highest Emotional Health Index score, while Vermont led all states in Healthy Behaviors for the second straight year. Massachusetts had the best score on the Basic Access Index for the fourth straight year, which is partially a result of having the highest percentage of residents with health insurance in the nation.
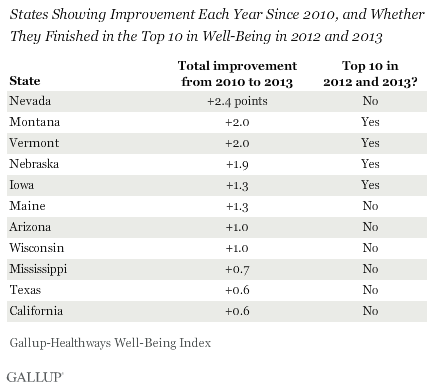
Eleven States' Well-Being Index Scores Have Improved Steadily Since 2010
Well-being has been fairly stable nationally since 2008. However, since 2010, the first full year after the Great Recession officially ended, 11 states' well-being scores have shown year-over-year improvement, with the largest gains seen in Nevada, Montana, Vermont, Nebraska, Iowa, and Maine. Four of these states -- Montana, Vermont, Nebraska, and Iowa -- also were among the top 10 well-being states in 2012 and 2013, making their continued improvement notable given their already high Well-Being Index scores.
Implications
Overall well-being in the U.S. and within states has been fairly steady since 2008, although the national Well-Being Index score fell in 2013. The nation's well-being declined despite improvement in economic confidence in most states. Still, steady growth in 11 states' well-being scores since 2010 illustrates that sustained improvements in well-being are possible regardless of national trends. Four states in particular -- Montana, Vermont, Nebraska, and Iowa -- demonstrate that steady progress is possible, even among the top 10 well-being states.
Gallup's research has shown that people take a variety of factors into account when evaluating their well-being. Job creation, for example, is related to well-being; Gallup's job creation rankings for 2013 are correlated with the well-being rankings. The 2013 Payroll to Population (P2P) state rankings are also correlated with top and bottom well-being states. North Dakota, which has benefited economically from the surge in its oil industry, was the top state in both job creation and P2P in 2013. And other behavioral factors, such as smoking rates, generally line up with well-being at the state level as well.
Regardless of metrics such as employment and job creation, all states rely on strong leadership to spearhead their well-being efforts. Iowa's Healthiest State Initiative, for example, is a privately led, government-supported program designed to improve Iowa's well-being, and has received Gov. Terry Branstad's support since its inception. This sort of steady advocacy for higher well-being can serve as a positive example for other leaders to follow as states try to improve their residents' well-being in 2014.
Gallup's "State of the States" series reveals state-by-state differences on political, economic, and well-being measures Gallup tracks each day. New stories based on full-year 2013 data will be released in the coming months.
Survey Methods
Results are based on telephone interviews conducted as part of the Gallup-Healthways Well-Being Index survey Jan. 2-Dec. 29, 2013, with a random sample of 178,072 adults, aged 18 and older, living in all 50 U.S. states and the District of Columbia.
For results based on the total sample of national adults, the margin of sampling error is ±1 percentage point at the 95% confidence level.
The margin of sampling error for most states is ±1 to ±2 percentage points, but is as high as ±4 points for states with smaller populations, such as Wyoming, North Dakota, South Dakota, Delaware, and Hawaii.
Interviews are conducted with respondents on landline telephones and cellular phones, with interviews conducted in Spanish for respondents who are primarily Spanish-speaking. Each sample of national adults includes a minimum quota of 50% cellphone respondents and 50% landline respondents, with additional minimum quotas by time zone within region. Landline telephone and cellphone numbers are selected using random-digit-dial methods. Landline respondents are chosen at random within each household on the basis of which member had the most recent birthday.
Samples are weighted to correct for unequal selection probability, nonresponse, and double coverage of landline and cell users in the two sampling frames. They are also weighted to match the national demographics of gender, age, race, Hispanic ethnicity, education, region, population density, and phone status (cellphone only/landline only/both, cellphone mostly, and having an unlisted landline number). Demographic weighting targets are based on the most recent Current Population Survey figures for the aged 18 and older U.S. population. Phone status targets are based on the most recent National Health Interview Survey. Population density targets are based on the most recent U.S. census. All reported margins of sampling error include the computed design effects for weighting.
In addition to sampling error, question wording and practical difficulties in conducting surveys can introduce error or bias into the findings of public opinion polls.
For more details on Gallup's polling methodology, visit www.gallup.com.
