Story Highlights
- Spending in October similar to September level
- Latest average among best for month of October
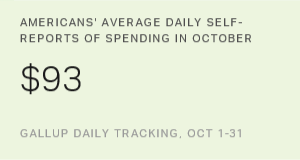
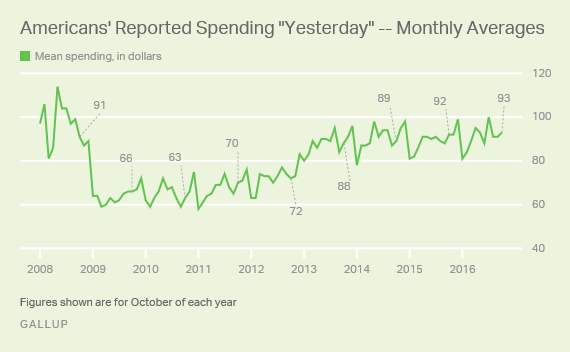
WASHINGTON, D.C. -- Americans' daily self-reports of spending averaged $93 in October. This is similar to September's $91 average, but is among the highest for the month of October in Gallup's nine-year trend.
These results are based on Gallup Daily tracking interviews conducted Oct. 1-31. Gallup asks Americans each night to report how much they spent "yesterday," excluding normal household bills and major purchases such as a home or car. The measure gives an indication of discretionary spending.
The latest spending average is similar to the $91 recorded in October 2008, a measure taken at the beginning of a steep slide in Americans' spending amid the financial crisis of 2008. Along with several other economic measures, spending plunged in 2009 and remained low for years -- October figures ranged from $66 to $72 between 2009 and 2012. It recovered by 2013, and since then, October averages have ranged from $88 to $93.
In recent years, spending has typically increased from September to October, though there have been exceptions. Spending dipped from September to October in 2008 and slightly in 2012, and remained flat in 2009. There is also no clear pattern for spending changes from October to November, though spending has increased slightly in most years since 2009.
| September | October | November | |||||||||||||||||||||||||||||||||||||||||||||||||||||||||||||||||||||||||||||||||||||||||||||||||
|---|---|---|---|---|---|---|---|---|---|---|---|---|---|---|---|---|---|---|---|---|---|---|---|---|---|---|---|---|---|---|---|---|---|---|---|---|---|---|---|---|---|---|---|---|---|---|---|---|---|---|---|---|---|---|---|---|---|---|---|---|---|---|---|---|---|---|---|---|---|---|---|---|---|---|---|---|---|---|---|---|---|---|---|---|---|---|---|---|---|---|---|---|---|---|---|---|---|---|---|
| 2016 | $91 | $93 | -- | ||||||||||||||||||||||||||||||||||||||||||||||||||||||||||||||||||||||||||||||||||||||||||||||||
| 2015 | $88 | $92 | $92 | ||||||||||||||||||||||||||||||||||||||||||||||||||||||||||||||||||||||||||||||||||||||||||||||||
| 2014 | $87 | $89 | $95 | ||||||||||||||||||||||||||||||||||||||||||||||||||||||||||||||||||||||||||||||||||||||||||||||||
| 2013 | $84 | $88 | $91 | ||||||||||||||||||||||||||||||||||||||||||||||||||||||||||||||||||||||||||||||||||||||||||||||||
| 2012 | $74 | $72 | $73 | ||||||||||||||||||||||||||||||||||||||||||||||||||||||||||||||||||||||||||||||||||||||||||||||||
| 2011 | $65 | $70 | $71 | ||||||||||||||||||||||||||||||||||||||||||||||||||||||||||||||||||||||||||||||||||||||||||||||||
| 2010 | $59 | $63 | $66 | ||||||||||||||||||||||||||||||||||||||||||||||||||||||||||||||||||||||||||||||||||||||||||||||||
| 2009 | $66 | $66 | $67 | ||||||||||||||||||||||||||||||||||||||||||||||||||||||||||||||||||||||||||||||||||||||||||||||||
| 2008 | $99 | $91 | $87 | ||||||||||||||||||||||||||||||||||||||||||||||||||||||||||||||||||||||||||||||||||||||||||||||||
| Gallup Daily tracking | |||||||||||||||||||||||||||||||||||||||||||||||||||||||||||||||||||||||||||||||||||||||||||||||||||
Bottom Line
Americans' spending remains relatively strong between the back-to-school and holiday seasons, which is an encouraging economic sign. October spending has been fairly constant, and robust, since 2013.
October's similar spending averages could be related to the limited movement in Americans' estimates of their upcoming holiday spending, which Gallup polls Americans on in October and November.
But November's spending average may be more indicative of actual holiday spending because it has served as a springboard for December. If spending inches higher this month, it could suggest a positive trend that could continue into December, a critical month for retail sales.
An unknown element in predictions about November spending, however, is the outcome of the presidential election and any possible effect it could have on consumers' overall mood.
These data are available in Gallup Analytics.
Survey Methods
Results for this Gallup poll are based on telephone interviews conducted Oct. 1-31, 2016, on the Gallup U.S. Daily survey, with a random sample of 15,269 adults, aged 18 and older, living in all 50 U.S. states and the District of Columbia. For results based on the total sample of national adults, the margin of sampling error is ±$5 at the 95% confidence level. All reported margins of sampling error include computed design effects for weighting.
Each sample of national adults includes a minimum quota of 60% cellphone respondents and 40% landline respondents, with additional minimum quotas by time zone within region. Landline and cellular telephone numbers are selected using random-digit-dial methods.
Learn more about how the Gallup U.S. Daily works.