Story Highlights
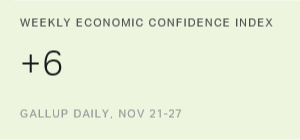
- Weekly U.S. Economic Confidence Index score at +6
- Three-day average also reaches new high, at +9
- Both current conditions and economic outlook scores are up
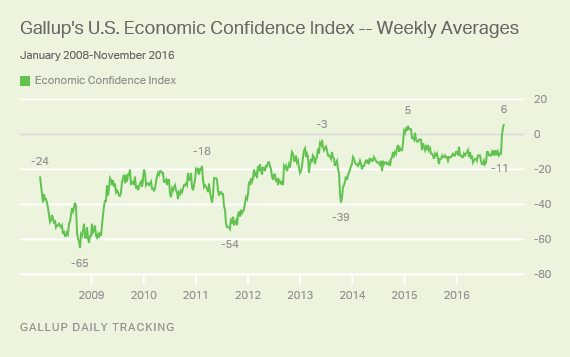
WASHINGTON, D.C. -- Americans expressed more positivity about the U.S. economy last week than they have at any other time during the nine years that Gallup has been tracking the U.S. Economic Confidence Index. The latest score of +6 for the week ending Nov. 27 inched past the previous high of +5 recorded in January 2015.
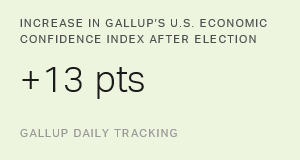
Americans' confidence in the economy recently shifted from negative to positive territory after Donald Trump was elected president three weeks ago. The index was -11 in the last full week before the Nov. 8 election, but then jumped to +4 the week after. Gallup noted that the change was largely attributable to Republicans becoming more optimistic about the economy's direction. Registering at +9 for Nov. 25-27, this three-day average bests the previous high of +7, which Gallup recorded after this November's election, as well as once before in January 2015.
Gallup's U.S. Economic Confidence Index is the average of two components: how Americans rate current economic conditions and whether they feel the economy is improving or getting worse. The index has a theoretical maximum of +100 if all Americans were to say the economy is doing well and improving, and a theoretical minimum of -100 if all Americans were to say the economy is doing poorly and getting worse.
Economic confidence has been below zero nearly continuously since 2008, hitting its lowest level of -65 in October 2008 at the onset of the financial crisis. Aside from the recent pair of positive index readings, Gallup's weekly scores were positive several times during a brief, three-month span from late 2014 to early 2015, when U.S. consumers enjoyed a sustained drop in gasoline prices.
Assessments of Current Economic Conditions Best in Nine Years
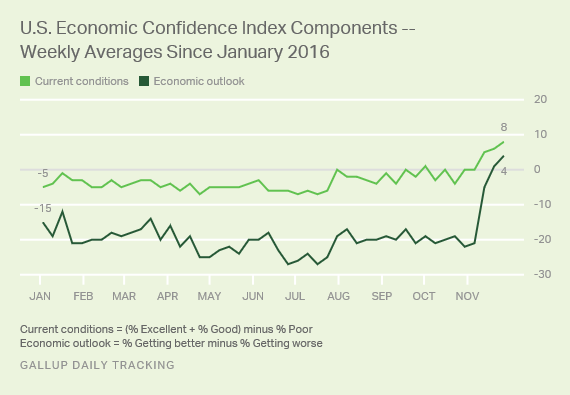
Thirty percent of Americans rated the economy as "excellent" or "good" last week, while 22% said it was "poor," resulting in a current conditions index of +8 -- this is, by one point, the highest score recorded for this component over the past nine years. The latest current conditions score is up two points from the prior week.
The economic outlook component is at its highest since February of last year. For the week ending Nov. 27, this component moved further into positive territory at +4, compared with +1 the previous week. The latest score is the result of 49% of Americans saying economic conditions in the country are "getting better" and 45% saying they are "getting worse."
Bottom Line
It's not just Americans who have felt more economically exuberant since the election -- U.S. markets have skyrocketed, with the Dow closing above 19,000 this week for the first time in its 120-year history.
So, while the election's results may have improved Americans' outlook on the economy, favorable market conditions may have driven their confidence further upward. This also comes as many economists expect that potential U.S. economic growth could have a significant effect worldwide.
It's too early to tell whether this uptick in Americans' positivity will last as Trump's term begins in January. But two weeks of positive index readings on the heels of his unexpected victory reveals a degree of economic confidence Americans have not expressed since the recession.
Historical data are available in Gallup Analytics.
Survey Methods
Results for this Gallup poll are based on telephone interviews conducted Nov. 21-27, 2016, on the Gallup U.S. Daily survey, with a random sample of 3,049 adults, aged 18 and older, living in all 50 U.S. states and the District of Columbia. For results based on the total sample of national adults, the margin of sampling error is ±2 percentage points at the 95% confidence level. All reported margins of sampling error include computed design effects for weighting.
Each sample of national adults includes a minimum quota of 60% cellphone respondents and 40% landline respondents, with additional minimum quotas by time zone within region. Landline and cellular telephone numbers are selected using random-digit-dial methods.
Learn more about how the Gallup U.S. Daily works.