Story Highlights
- Spending figure one of the highest in past Januaries
- Decline of $17 from December consistent with previous January drops
- High- and low-income groups both report less spending
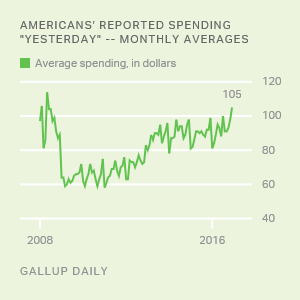
WASHINGTON, D.C. -- Americans' daily self-reports of spending fell to an average of $88 in January, down from $105 in December. This is consistent with the drops in January over the previous four years.
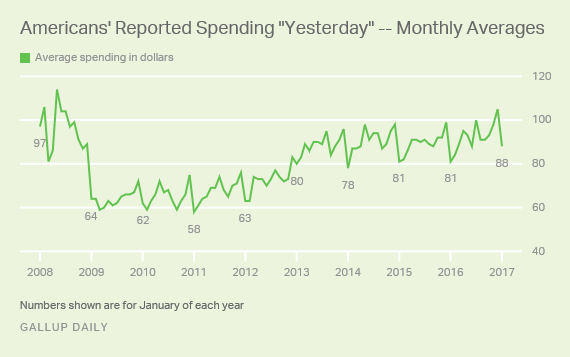
Still, this is the highest daily consumer spending average for the month of January since 2008, when the average was $97. Later that same year, consumer spending began to drop, as the U.S. economy faltered during the Great Recession. In January 2011, the average reached a low point of $58. Since 2013, Americans' self-reports of spending have stayed in the $78 to $88 range in January.
Decline From December to January Typical of Most Years
While December is often the highest month for consumer spending -- and December 2016 was the highest December in nine years -- January is often the lowest. The drop of $17 this year in Americans' self-reported spending from December to January is consistent with the declines in spending between the two months in each of the past four years. The smallest January drop in the nine-year history of this measure was from December 2012-January 2013, at $3. In the midst of the Great Recession, the biggest January drop occurred from December 2008-January 2009, when spending declined $25 in a month's time.
| Years | December | January | Difference, January vs. December | ||||||||||||||||||||||||||||||||||||||||||||||||||||||||||||||||||||||||||||||||||||||||||||||||
|---|---|---|---|---|---|---|---|---|---|---|---|---|---|---|---|---|---|---|---|---|---|---|---|---|---|---|---|---|---|---|---|---|---|---|---|---|---|---|---|---|---|---|---|---|---|---|---|---|---|---|---|---|---|---|---|---|---|---|---|---|---|---|---|---|---|---|---|---|---|---|---|---|---|---|---|---|---|---|---|---|---|---|---|---|---|---|---|---|---|---|---|---|---|---|---|---|---|---|---|
| $ | $ | $ | |||||||||||||||||||||||||||||||||||||||||||||||||||||||||||||||||||||||||||||||||||||||||||||||||
| 2016-2017 | 105 | 88 | -17 | ||||||||||||||||||||||||||||||||||||||||||||||||||||||||||||||||||||||||||||||||||||||||||||||||
| 2015-2016 | 99 | 81 | -18 | ||||||||||||||||||||||||||||||||||||||||||||||||||||||||||||||||||||||||||||||||||||||||||||||||
| 2014-2015 | 98 | 81 | -17 | ||||||||||||||||||||||||||||||||||||||||||||||||||||||||||||||||||||||||||||||||||||||||||||||||
| 2013-2014 | 96 | 78 | -18 | ||||||||||||||||||||||||||||||||||||||||||||||||||||||||||||||||||||||||||||||||||||||||||||||||
| 2012-2013 | 83 | 80 | -3 | ||||||||||||||||||||||||||||||||||||||||||||||||||||||||||||||||||||||||||||||||||||||||||||||||
| 2011-2012 | 76 | 63 | -13 | ||||||||||||||||||||||||||||||||||||||||||||||||||||||||||||||||||||||||||||||||||||||||||||||||
| 2010-2011 | 75 | 58 | -17 | ||||||||||||||||||||||||||||||||||||||||||||||||||||||||||||||||||||||||||||||||||||||||||||||||
| 2009-2010 | 72 | 62 | -10 | ||||||||||||||||||||||||||||||||||||||||||||||||||||||||||||||||||||||||||||||||||||||||||||||||
| 2008-2009 | 89 | 64 | -25 | ||||||||||||||||||||||||||||||||||||||||||||||||||||||||||||||||||||||||||||||||||||||||||||||||
| Note: Daily tracking began in January 2008, so there is no 2007-2008 comparison | |||||||||||||||||||||||||||||||||||||||||||||||||||||||||||||||||||||||||||||||||||||||||||||||||||
| Gallup Daily | |||||||||||||||||||||||||||||||||||||||||||||||||||||||||||||||||||||||||||||||||||||||||||||||||||
Among income groups, spending in January dropped not only among people making at least $90,000 annually but also among those making less than that. The same happened one year ago at this time.
Still, as Januaries go, the past few have seen a pronounced uptick in monthly consumer spending among all Americans.
Bottom Line
While there was a marked drop in Americans' self-reported spending in January compared with December, last month was one of the highest January spending figures in the nine-year history of Gallup's tracking. This may be attributed to a healthy job market, rising economic confidence and an overall improving economy.
Rising stock values may also be helping Americans feel better about their finances, at least for those who own stock. With December breaking the $100 mark for average daily spending and an expected rebound in February through the spring, consumer spending in 2017 may be poised to reach even higher levels. If that occurs, it could jump-start economic growth in the country, because consumer spending accounts for the lion's share of the U.S. gross domestic product.
These data are available in Gallup Analytics.
Gallup.com reports results from these indexes in daily, weekly and monthly averages and in Gallup.com stories. Complete trend data are always available to view in the following charts:
Daily: Employment, Economic Confidence, Consumer Spending
Weekly: Employment, Economic Confidence, Job Creation, Consumer Spending
Read more about Gallup's economic measures.
View our economic release schedule.
Survey Methods
Results for this Gallup poll are based on telephone interviews conducted Jan. 2-31, 2017, on the Gallup Daily tracking survey, with a random sample of 14,720 adults, aged 18 and older, living in all 50 U.S. states and the District of Columbia. For results based on the total sample of national adults, the margin of sampling error is ±$5 at the 95% confidence level. All reported margins of sampling error include computed design effects for weighting.
Each sample of national adults includes a minimum quota of 70% cellphone respondents and 30% landline respondents, with additional minimum quotas by time zone within region. Landline and cellular telephone numbers are selected using random-digit-dial methods.
Learn more about how the Gallup U.S. Daily works.