Story Highlights
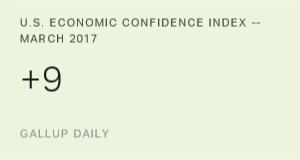
- March's +9 score similar to February's +8
- Scores were much higher earlier than later in the month
- Dueling trajectories for Democrats', Republicans' economic confidence
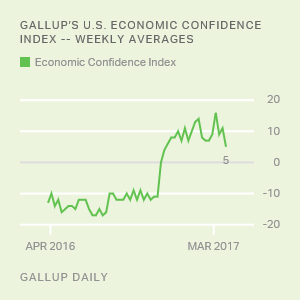
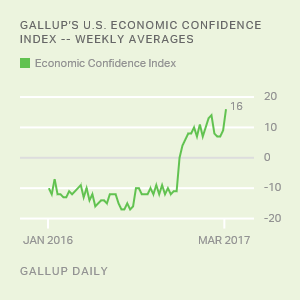
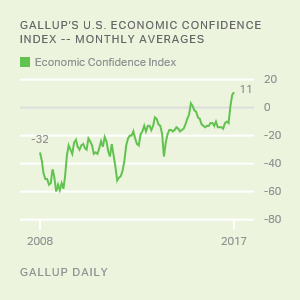
WASHINGTON, D.C. -- Americans remained about as upbeat about the economy in March as they were in February, with Gallup's U.S. Economic Confidence Index averaging +9 for the third month of 2017. Weekly readings of the index, however, show that confidence was strongest in early March after massive gains in the Dow Jones industrial average in February. More recent index scores in March have been slightly positive, but are much lower than the high scores from early March.
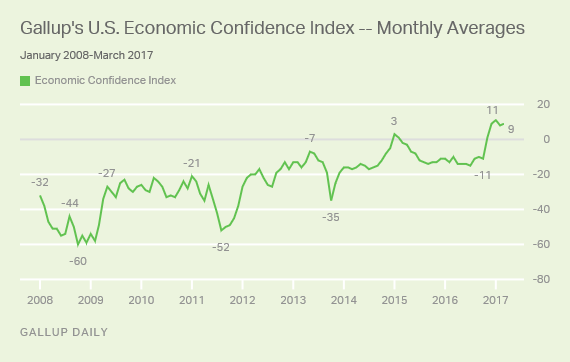
Americans' confidence in the economy took a hit as the stock market fell from its high point in early March. The index's past two weekly readings were +5, down significantly from +16 recorded in the first week of the month -- the highest score in Gallup's tracking of the index since 2008.
Still, Americans' economic confidence has remained positive overall for 20 straight weeks -- since the week after the presidential election in November -- making it the longest positive streak since Gallup began tracking the measure.
Gallup's U.S. Economic Confidence Index is the average of two components: how Americans rate current economic conditions and whether they feel the economy is improving or getting worse. The index has a theoretical maximum of +100 if all Americans were to say the economy is doing well and improving, and a theoretical minimum of -100 if all Americans were to say the economy is doing poorly and getting worse.
In March, one-third of U.S. adults (33%) described economic conditions as "excellent" or "good," while 20% rated them as "poor." This resulted in a current conditions score of +13 for the month -- the same as in February.
Meanwhile, 49% of U.S. adults said economic conditions were "getting better," while 45% said they were "getting worse," resulting in an economic outlook score of +4 -- similar to February's +3 for this component.
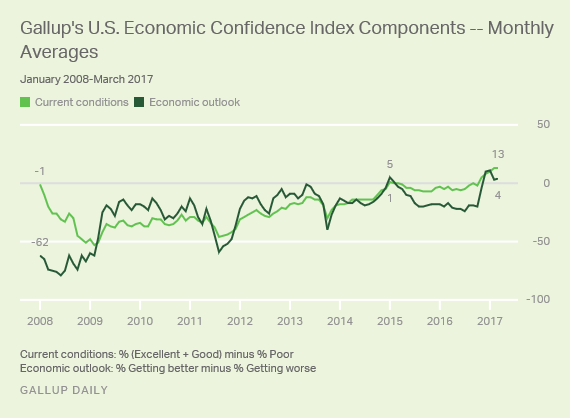
For the week ending April 2, the current conditions score was +10 (32% excellent or good vs. 22% poor), while the economic outlook score was -1 (46% getting better vs. 47% getting worse).
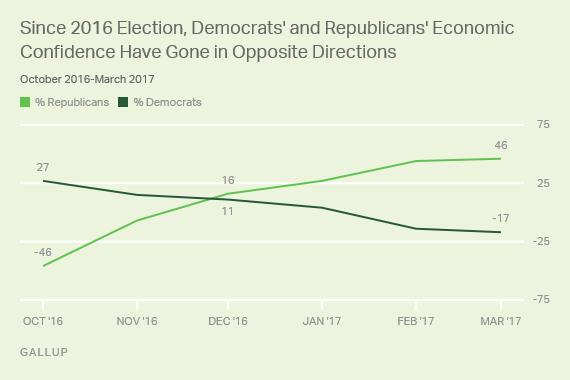
Over Six Months, Republicans' Index Score Went From -46 to +46
As Gallup has previously noted, the 2016 election dramatically affected economic confidence, with Republicans becoming largely positive in their views of the economy and Democrats becoming negative.
Republicans' level of confidence has steadily improved over the past six months, with their largest gains taking place after President Donald Trump's election and after his inauguration. Their confidence under a Republican president hasn't deteriorated since, with their current +46 rating dramatically higher than their -46 rating in the month before the election.
Democrats have experienced the opposite, but with a smaller degree of change compared with Republicans. Democrats' index score was +27 in October, while their current score is -17 -- their lowest since December 2011.
Bottom Line
Though the stock market entered March at a strong point, its record-high gains partially dissipated throughout the month. Americans' reactions to these fluctuations are evident in the weekly index readings -- particularly the fact that just as many now say the economy is getting worse as say it is getting better.
While other economic surveys have found March to have been a robust month for economic confidence, these metrics largely reflect the strong level of confidence at the beginning of the month but, due to their timing in the field, don't capture the slide toward the end of the month.
These data are available in Gallup Analytics.
Gallup.com reports results from these indexes in daily, weekly and monthly averages and in Gallup.com stories. Complete trend data are always available to view in the following charts:
Daily: Employment, Economic Confidence, Consumer Spending
Weekly: Employment, Economic Confidence, Job Creation, Consumer Spending
Read more about Gallup's economic measures.
View our economic release schedule.
Survey Methods
Results for this Gallup poll are based on telephone interviews conducted March 1-31, 2017, on the Gallup U.S. Daily survey, with a random sample of 15,703 adults, aged 18 and older, living in all 50 U.S. states and the District of Columbia. For results based on the total sample of national adults, the margin of sampling error is ±1 percentage point at the 95% confidence level. All reported margins of sampling error include computed design effects for weighting.
Each sample of national adults includes a minimum quota of 70% cellphone respondents and 30% landline respondents, with additional minimum quotas by time zone within region. Landline and cellular telephone numbers are selected using random-digit-dial methods.
Learn more about how Gallup Daily tracking works.