Story Highlights
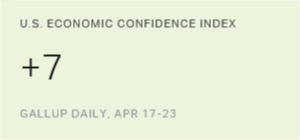
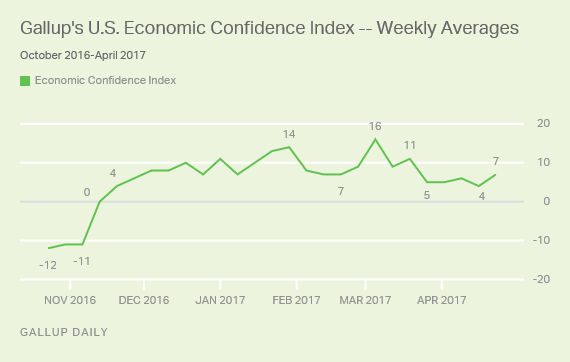
- Gallup's U.S. Economic Confidence Index at +7 last week
- Score is in line with those in recent weeks but down from highs in January, March
- Economic outlook component remains well below its highest point
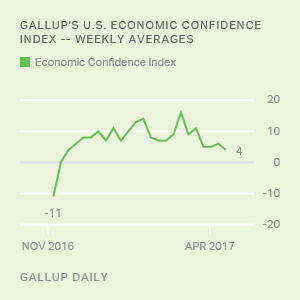
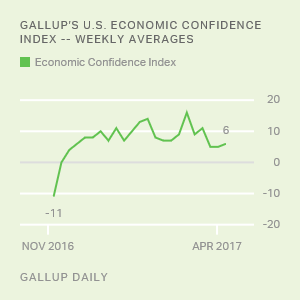
WASHINGTON, D.C. -- Americans have remained upbeat about the economy for 24 straight weeks, though their current level of confidence is lower than it was earlier in the year. Gallup's U.S. Economic Confidence Index stood at +7 last week, generally in line with readings since the November presidential election. However, it is below the +16 score observed in early March and similar high scores in late January.
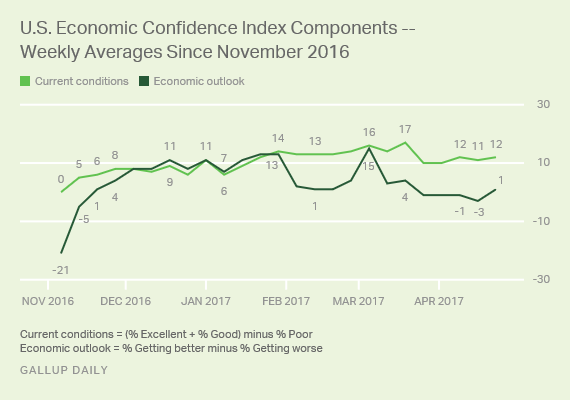
Gallup's U.S. Economic Confidence Index is the average of two components: how Americans rate current economic conditions and whether they feel the economy is improving or getting worse. The index has a theoretical maximum of +100 if all Americans were to say the economy is doing well and improving, and a theoretical minimum of -100 if all were to say the economy is doing poorly and getting worse.
Shortly after the presidential election, Gallup's U.S. Economic Confidence Index crossed into positive territory for the first time in nearly two years. The index's overall improvement was mainly attributable to a surge in confidence among Republicans, who expressed widespread dissatisfaction with the state of the economy during former President Barack Obama's tenure but whose opinions quickly changed course after a Republican won the White House.
While Republicans were mostly responsible for the uptick in economic confidence late last year, other Americans also found a reason to improve their assessment of the economy, as evidenced by the index's rise throughout the presidential transition period.
The measure hit a nine-year high of +14 in the last week of January, coinciding with President Donald Trump's inauguration, before retreating in the ensuing weeks. In early March, confidence reached a new peak of +16.
Since then, however, confidence has fallen back to levels similar to those recorded immediately after Trump's election. Nonetheless, Americans are still significantly more confident in the economy than they were before the election.
Outlook Component Well Below Peaks in January, March
For the week ending April 23, 33% of Americans assessed the economy as "excellent" or "good," while 21% rated it as "poor," resulting in a +12 current conditions score -- similar to the +11 score from the prior week.
Meanwhile, 47% of Americans last week said the economy was getting better, while 46% said it was getting worse, resulting in an economic outlook score of +1. While this represents an improvement from the previous week's score of -3, the economic outlook component has fallen considerably from +15 in early March and +13 in the last two weeks of January.
Bottom Line
Americans remain optimistic about the health of the U.S. economy, though they are not quite as optimistic as they were shortly after Trump's inauguration or in early March as financial markets registered their best performance to date. While the index has fallen from its record high in March, it has been stable for the past five weeks.
This week could be a fateful one for the U.S. economy with a number of economic policies on the legislative agenda, including tax reform, a second attempt to fundamentally change the federal healthcare law known as "Obamacare," and a funding deal that must be reached by Friday to avoid a shutdown of the federal government.
It is not clear whether any of these policies will immediately affect economic confidence unless Trump and Congress cannot avert a government shutdown. The last time the federal government shut down, in 2013, Gallup's Economic Confidence Index fell 12 points in one week -- the largest drop the index experienced since the bankruptcy of Lehman Brothers in September 2008 sparked a global financial crisis.
These data are available in Gallup Analytics.
Gallup.com reports results from these indexes in daily, weekly and monthly averages and in Gallup.com stories. Complete trend data are always available to view in the following charts:
Daily: Employment, Economic Confidence, Consumer Spending
Weekly: Employment, Economic Confidence, Job Creation, Consumer Spending
Read more about Gallup's economic measures.
View our economic release schedule.
Survey Methods
Results for this Gallup poll are based on telephone interviews conducted April 17-23, 2017, on the Gallup U.S. Daily survey, with a random sample of 3,545 adults, aged 18 and older, living in all 50 U.S. states and the District of Columbia. For results based on the total sample of national adults, the margin of sampling error is ±2 percentage points at the 95% confidence level. All reported margins of sampling error include computed design effects for weighting.
Each sample of national adults includes a minimum quota of 70% cellphone respondents and 30% landline respondents, with additional minimum quotas by time zone within region. Landline and cellular telephone numbers are selected using random-digit-dial methods.
Learn more about how the Gallup U.S. Daily works.