Gallup Access: A Workplace Platform for the Employee Experience
Gallup Access is organizational software that helps leaders, managers, and HR professionals identify where workplace performance breaks down, where opportunity exists, and what to do next to improve engagement, culture, and results.
Key Features of Gallup’s Employee Experience Platform
Gallup Access includes the core capabilities organizations need to measure, understand and improve the employee experience at scale. The platform combines employee feedback software, people analytics, manager tools and strengths-based development into one unified workplace system.
Employee Feedback Software and Analytics
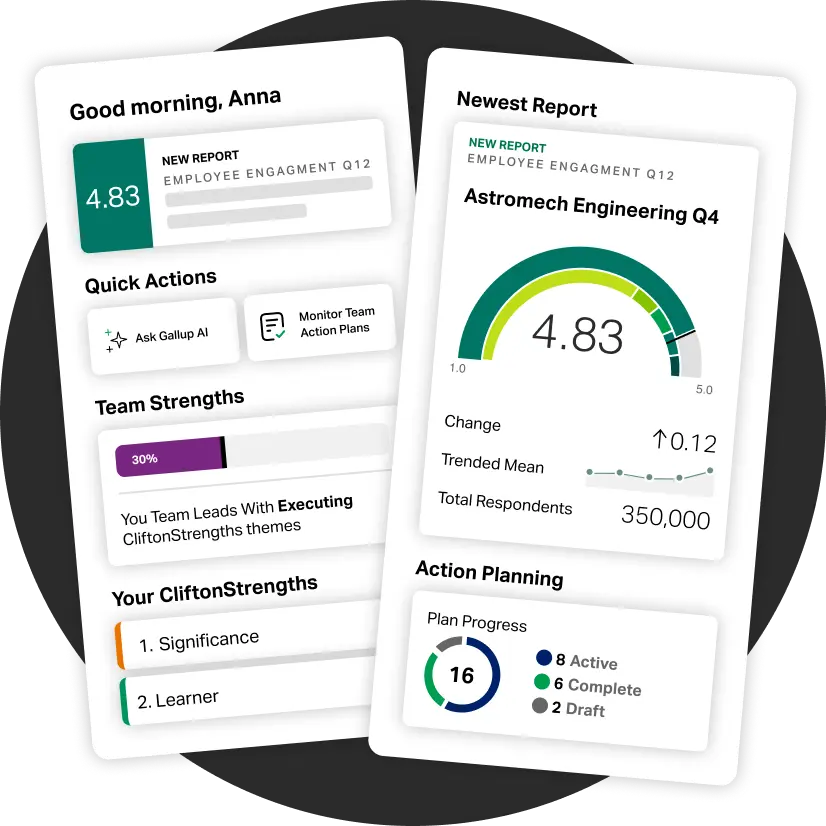
- Engagement, life cycle and employee pulse survey tools
- Survey distribution, response tracking and analysis
- Text analytics, heatmaps and benchmarking
Team Effectiveness and People Management Tools
- CliftonStrengths® results and team grids
- Employee engagement action plan and accountability tools
- Personalized dashboards for managers and teams
Workplace AI Insights
- Workplace and HR AI tools trained on Gallup’s proprietary strengths, engagement, and workplace research
- Real-time guidance to interpret results, generate actions and support teams
Platform Architecture and Integration
- Cloud-based platform with role-based access
- HRIS-powered data synchronization
- Secure, scalable infrastructure for enterprise use
How Does Gallup’s Workplace Platform Help Organizations Improve Performance?
Gallup Access improves performance by strengthening the employee experience — especially employee engagement and strengths-based development — through validated measurement and people analytics. The platform shows leaders where performance risks and opportunities exist across teams and at different stages of the employee life cycle and guides them toward targeted actions with measurable results.
The platform helps leaders see where performance is strong, where it is slipping and how to increase employee engagement.
Two Research-Backed Factors Linked to Stronger Performance
Employee engagement and strengths-based development are two of the strongest predictors of team performance, retention, and profitability. Gallup’s research shows that when organizations improve these elements of the employee experience, business outcomes improve as well.
Engaged teams outperform their peers.
Top-quartile engaged teams see:
23% higher profitability
18% higher productivity (sales)
78% lower absenteeism
21% lower turnover for high-turnover organizations
Strengths-based development produces measurable gains.
Employees who use their strengths are:
6x as likely to be engaged in their job
6x as likely to strongly agree that they have the chance to do what they do best every day
3xas likely to report having an excellent quality of life
How Gallup Access Supports These Outcomes
Gallup Access turns engagement and strengths into daily practice. It gives leaders tools to measure results, understand what they mean and take action through three core areas:
Employee Experience and Employee Engagement Software and Analytics
Measure engagement and experience using validated surveys and benchmarks to identify strengths, risks, and opportunities.
CliftonStrengths Solutions
Apply a strengths-based approach to individual and team development to improve collaboration and performance.

AI Trained on Gallup Expertise
Receive real-time, research-backed guidance that helps managers interpret results and determine next steps.
Employee Feedback Tools Built to Improve the Employee Experience
Gallup Access provides employee surveys and feedback tools that help organizations measure engagement, understand employee experiences, and act on results. These tools support continuous listening across the employee life cycle and turn survey data into clear, practical next steps.
Core Feedback Capabilities
These tools help organizations listen to employees and respond with clarity.
Employee Engagement Survey Tools
Employee Engagement Survey Tools
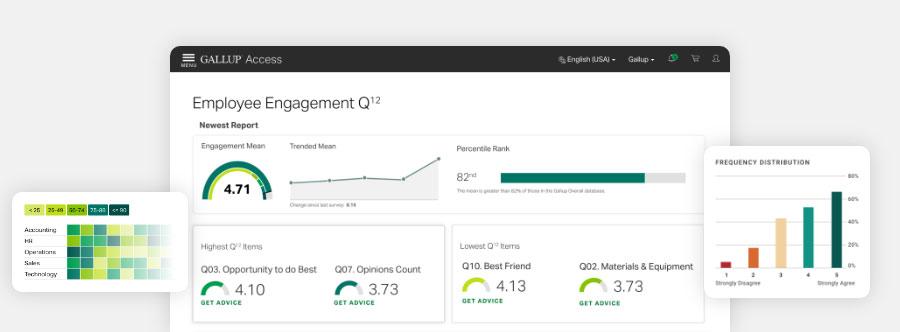
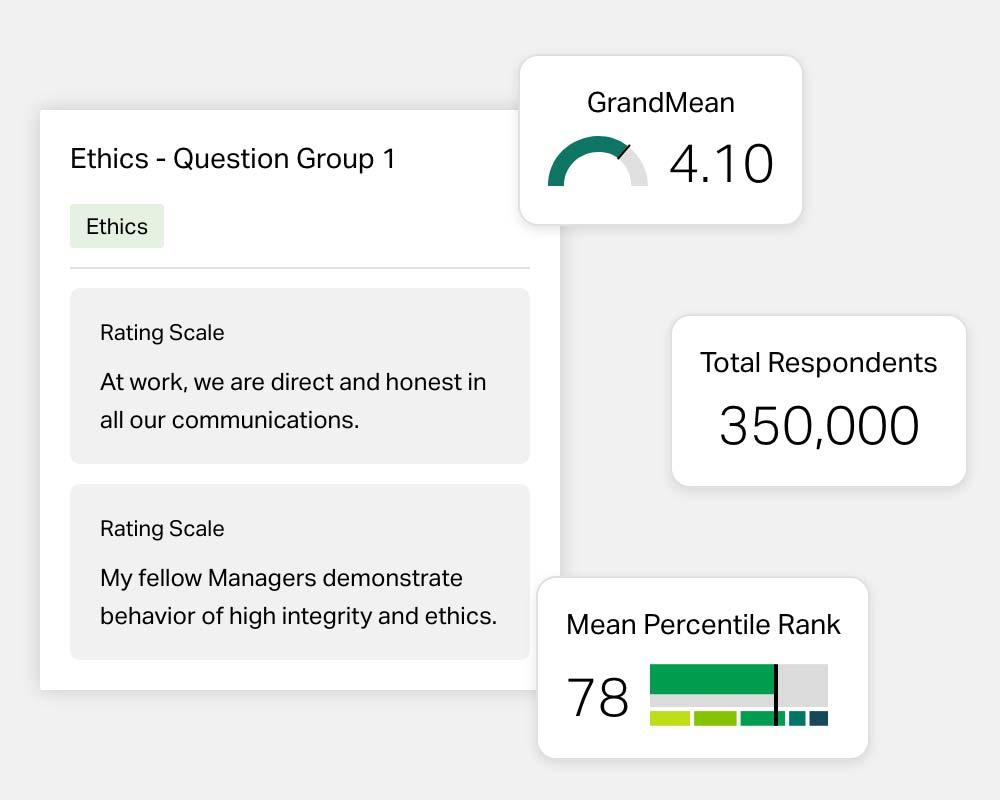
The Q12® is Gallup’s validated employee engagement survey and the foundation of its engagement measurement approach. Gallup built the survey on 12 proven employee engagement questions that measure the elements most closely linked to performance across industries and roles.
Organizations can use the core 12 questions or add validated items to expand their measurement scope.
Life Cycle and Pulse Survey Tools
Life Cycle and Pulse Survey Tools
Gallup Access includes employee experience surveys, workplace culture surveys and unlimited workplace pulse surveys to help organizations listen more frequently. Leaders can choose from more than 350 validated questions or create custom items to measure specific moments across the employee life cycle.
These tools enable continuous feedback while helping organizations manage survey fatigue.
Analytics and Reporting
Analytics and Reporting
Built-in analytics and visualization tools help leaders quickly understand survey results and identify patterns in employee sentiment. Heatmaps, text analytics, benchmarking, and one-click presentations make it easier to identify patterns and prioritize action.
Action Planning and Follow-Through
Action Planning and Follow-Through
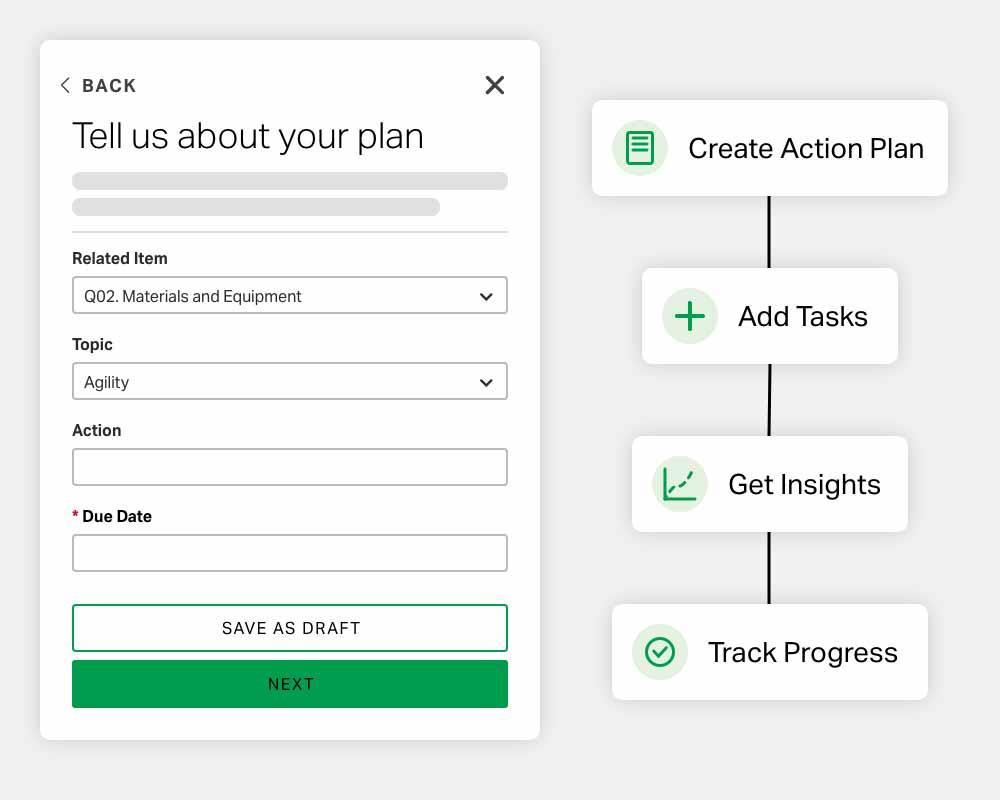
Gallup Access provides point-in-time recommendations and action planning tools that help managers respond to feedback and build effective employee engagement action plans.
These tools reinforce accountability, build trust and make action planning a consistent part of the employee listening process. Teams that use Gallup’s action planning tools improve employee engagement twice as fast as teams that don't.
CliftonStrengths Tools That Create High-Performing Teams
Gallup Access includes CliftonStrengths tools that help leaders, managers and coaches understand how people do their best work. When organizations focus on strengths rather than weaknesses, collaboration improves, communication becomes clearer and performance increases.
These tools support individual development and team effectiveness by making talents visible and usable in daily work and serving as practical team engagement tools for leaders and managers.
Core CliftonStrengths Capabilities
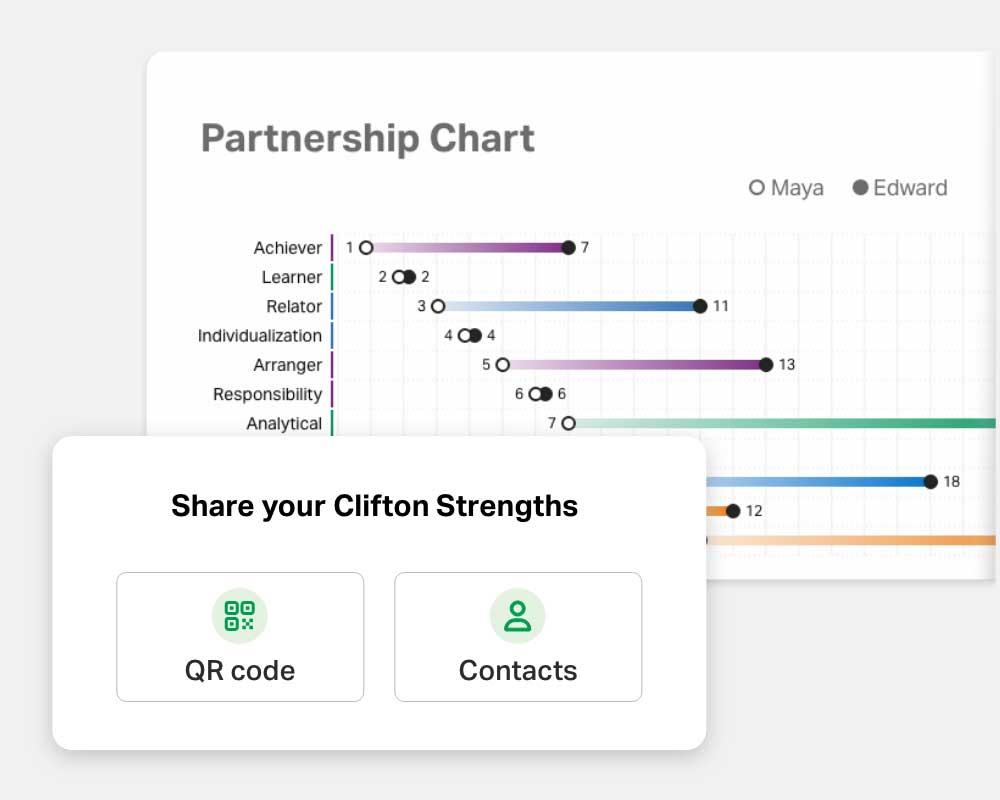
Team Reports and Team Grids
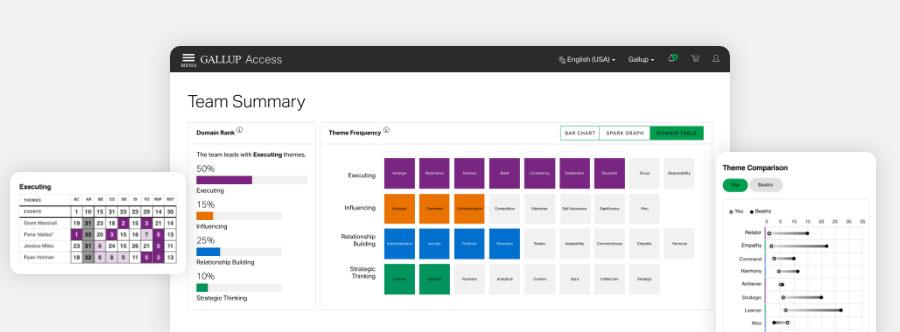
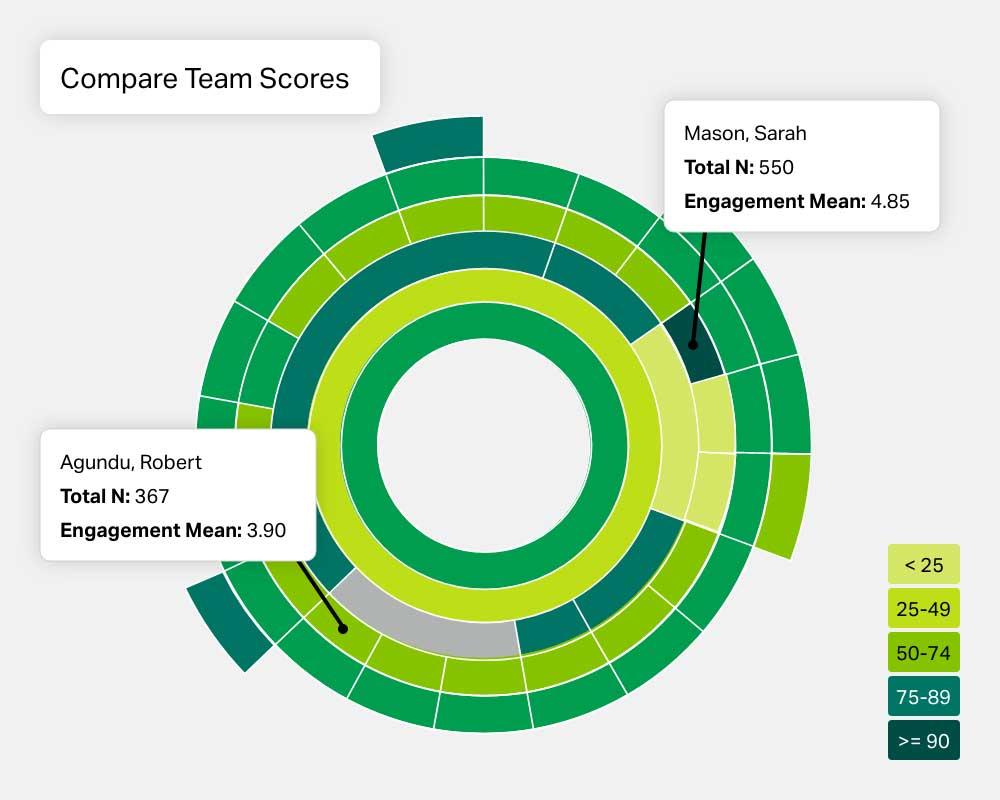
Team Reports and Team Grids
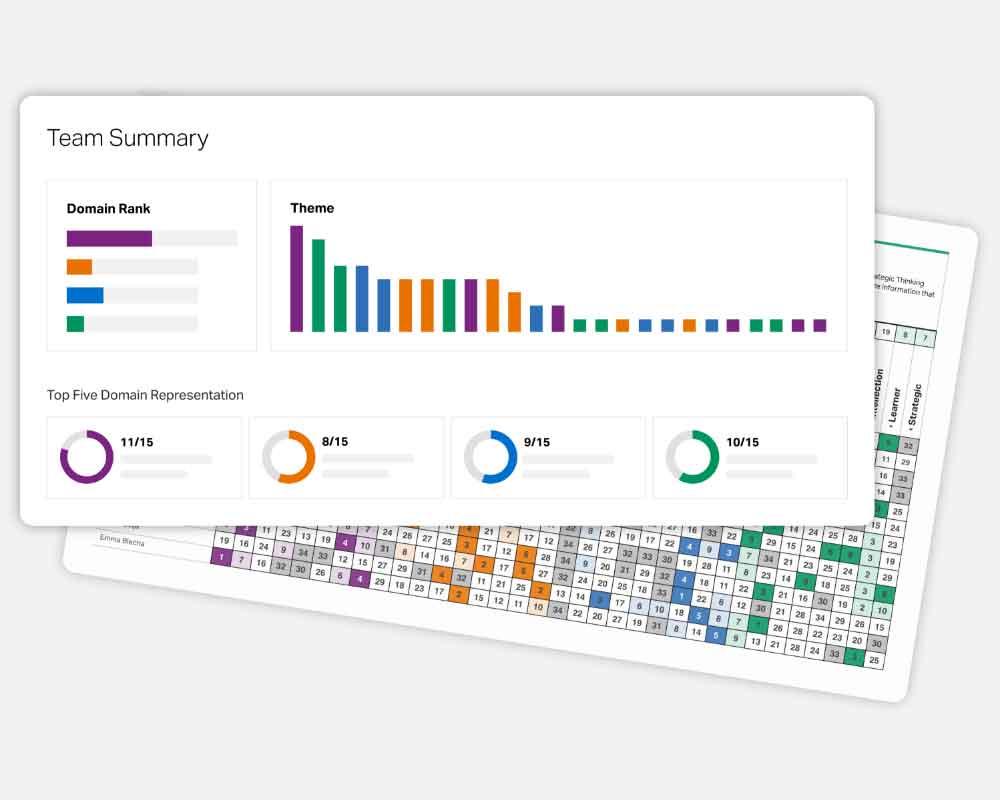
CliftonStrengths reports and team grids show a team’s collective strengths, gaps, and potential partnerships. Leaders can quickly see how talents combine, where collaboration is strongest and how to align work more effectively.
Teams use this information to plan, solve problems and carry out their work more effectively.
Strengths-Based Connections
Strengths-Based Connections
Gallup Access allows users to share and compare strengths across teams and organizations. These connections help people build better working relationships by understanding how others think, decide and contribute.
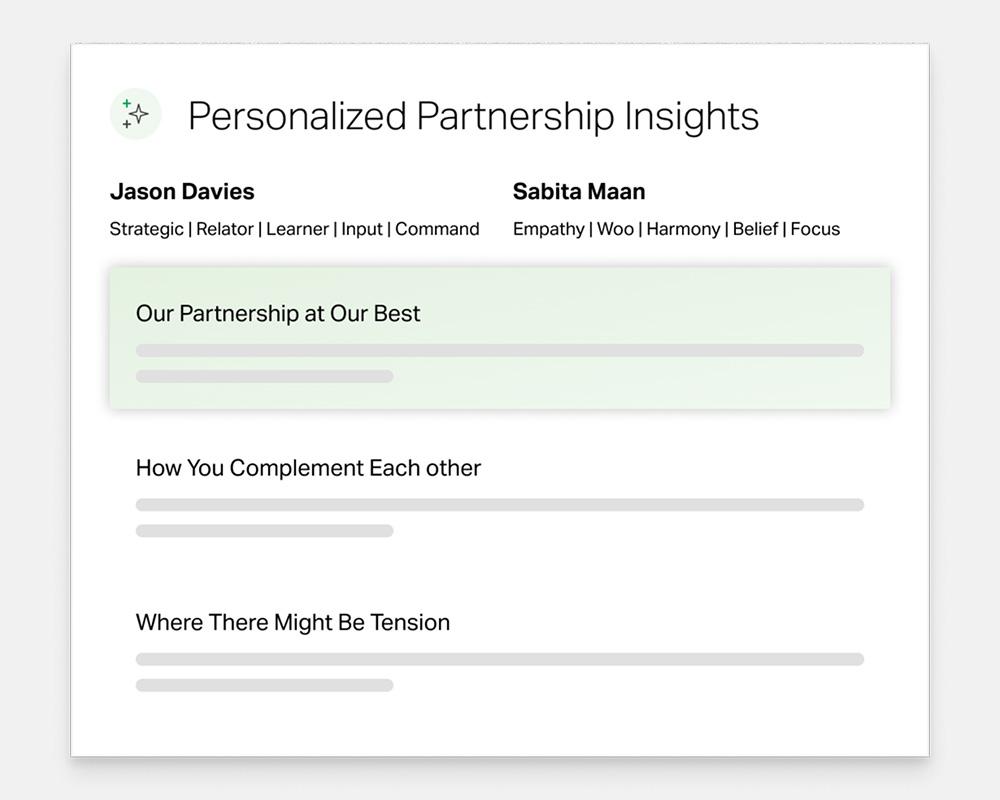
AI-Generated Strengths Insights
AI-Generated Strengths Insights
AI-powered strengths insights provide instant, strengths-based guidance for teams and partnerships. Based on each person’s CliftonStrengths, the platform highlights collaboration opportunities, potential friction points and clear next steps.
AI-Powered Workplace Advice and Solutions Built on Gallup’s Research
Gallup AI, available through Gallup Access, provides real-time workplace guidance. It’s AI for human resources, leaders, managers, and teams that helps users interpret employee feedback, apply strengths-based insights, and identify practical actions to improve engagement and performance.
Unlike general-purpose AI tools, Gallup AI is trained on Gallup’s strengths, engagement and workplace data, ensuring guidance reflects validated research.
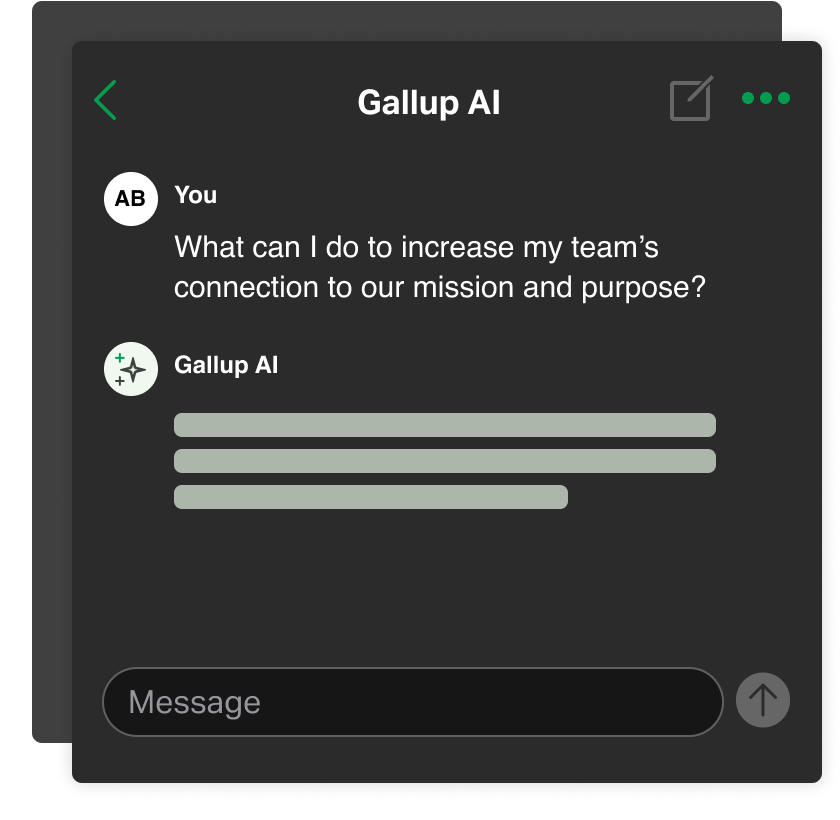
Core Gallup AI Capabilities
- Strengths-based guidance tailored to an individual’s top CliftonStrengths
- On-demand support for interpreting engagement and survey results
- Suggested actions and discussion prompts for managers and teams
Learning and Development Software for Performance and Growth
Gallup Access provides on-demand learning and development content for employees, managers, and teams at every stage of the employee life cycle.
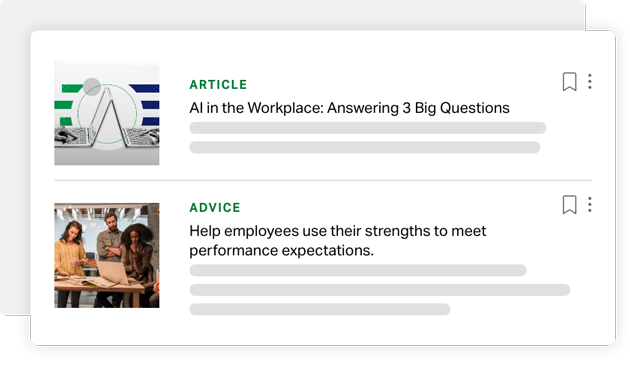
The platform offers targeted resources that help users apply strengths, improve engagement and build better workplace habits.
Gallup aligns learning with engagement data and manager needs, ensuring development reinforces what matters most to each team’s performance.
Learning Capabilities
- Microlearning modules focused on workplace skills, engagement and development
- Longer learning paths for deeper growth and role-based development
- Smart recommendations that align learning with survey results and goals
- AI-driven guidance that helps users apply what they learn in real time
Employee Experience and Workplace Analytics Mobile App
The Gallup Access mobile app gives users access to key platform features from any device. Employees, managers, and leaders can view insights, apply strengths-based guidance, and act on employee feedback in real time.
The app supports ongoing engagement, collaboration and development wherever work happens.
Mobile App Capabilities
- Access to Gallup AI workplace guidance
- CliftonStrengths results, team grids and reports
- Employee survey results and workplace insights
- AI-generated team and partnership insights
- Customizable notifications and alerts
See How Employee Engagement and Employee Development Work in One Platform
Fill out this form to schedule a personalized live walkthrough of Gallup Access tailored to your organization’s needs. Meet with a Gallup team member to explore key workflows, including surveys, analytics, strengths-based tools and AI-powered guidance.