Detroit Voices Data Dashboard
Gallup and the Detroit Regional Chamber have partnered to better understand the perceptions and life experiences of Detroit residents.
Detroit Resident Voices
Building on prior survey research from more than 11,000 residents across the Detroit metropolitan area, a new tool developed by Gallup and the Detroit Regional Chamber enables an interactive exploration of residents’ evaluations of key wellbeing, economic and community measures. These data provide a detailed, localized view of conditions within the Detroit metropolitan area, offering insight into patterns in access to opportunity and quality of life.
Explore Data Across the Detroit Area
Explore data across the city of Detroit, the tri-county area, and regional municipalities and neighborhoods throughout the Detroit metropolitan area. Use the map to compare patterns across a range of community indicators and examine local trends. This tool brings together residents’ voices from the survey alongside relevant external data to provide a more complete view of community conditions.
Data source: Detroit Voices Survey conducted by Gallup and the Detroit Regional Chamber, 2022. Supplementary data from external sources. Map tiles © Mapbox © OpenStreetMap.
Compare the Detroit Area to the Nation
Use the tables below to see how different counties, municipalities and neighborhoods in the Detroit tri-county area compare to national and regional benchmarks on various measures.
How to Use the Interactive Map
Below are answers to frequently asked questions about the interactive map.
What does this map show?
The map visualizes quality of life indicators, including wellbeing (using the Gallup Life Evaluation Index categories), financial security, and satisfaction with schools, healthcare, housing and job availability, as well as perceptions of community safety, confidence in local police, intent to move and reasons for leaving, and access to neighborhood amenities and services.
How do I change what I'm viewing?
Click on “County,” “Municipality” or “Neighborhood” at the top of the map legend to switch between views showing different geographic levels — by county (Wayne, Oakland and Macomb), municipality (across the tri-county area) and neighborhood (within the city of Detroit).
How do I select measures, and can I compare different measures?
Yes. Under the “Data” tab, click on “Gallup survey” or “External data,” and pick a topic of interest. Under each topic, drag any measure into the light green box on top; then drag and add a second measure to see how they compare across geographies. You can select up to two measures and explore them in tandem.
How do I see details for a specific area?
Hover over any area on the map to view additional details, including location name, population size, number of survey respondents, and a brief description of the selected measure(s). Click on any area of the map to view additional data from other response categories for each measure and to compare across two selected areas.
Where do the data come from?
The data are based on the Detroit Resident Voices Survey conducted by Gallup and the Detroit Regional Chamber in 2022, along with select external data where noted. External data come from a variety of sources and years, and to view the specific source and year for a given measure, hover over the arrow to the right of the measure name.
Why are some areas not shaded in the green palette colors?
Some areas did not have enough survey responses to report reliable results. These areas are shown in gray hatch pattern. Hover over these areas to see the name of the area, population size, and size of the survey sample of respondents.
For neighborhoods or municipalities with too few responses, results are not displayed. However, these responses are still included in the overall county-level results.
This map is part of a broader ecosystem of data and research on the Detroit region. For additional insights, explore:
- Detroit Future City: A Detroit-based think tank that develops data-driven strategies and research to support equitable and sustainable growth across the city.
- Data Driven Detroit: A nonprofit data hub that provides publicly accessible datasets, maps and analysis on neighborhood conditions, housing, health and more to support informed decision-making.
- Detroit Data Center: The Detroit Regional Chamber's online data dashboard resource provides extensive workforce and industry statistics for the 11-county Detroit region to make data-driven business, philanthropic and policy decisions.
Explore Sample Data From the Interactive Map
Below is a sample of findings from the research by county, municipality and neighborhood. Try searching these measures in the map to see the data for yourself!
Counties
Counties (Wayne, Oakland, Macomb)
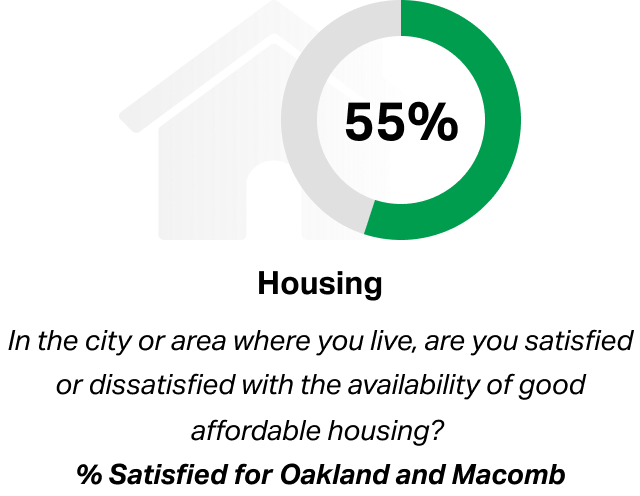
Perceptions of housing unaffordability are middling across the three counties.
Despite Oakland's higher wellbeing (57% thriving) and financial comfort (44%) rates, housing satisfaction compared to Macomb County is identical (55%), with Wayne County slightly lower (46%). External data confirm the paradox: Despite Oakland County's median home sale price of $315,000 and median household income of $105,000 — far above Wayne County's $179,000 and $65,000 — housing satisfaction converges across all three counties.
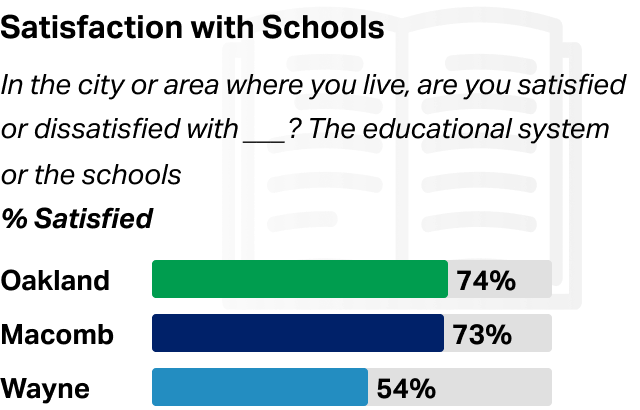
Detroiters are mostly satisfied with schools across the region.
In Oakland (74%) and Macomb Counties (73%), satisfaction with schools is slightly higher than in Wayne County (54%).
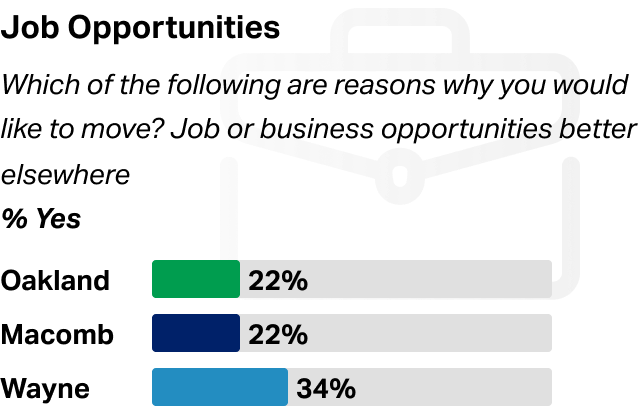
Job availability may drive relocation among residents in Wayne County.
While majorities in all three counties say they are satisfied with the availability of good jobs in their area, those in Wayne (34%) are slightly more likely than those in Macomb (22%) and Oakland (22%) to say job opportunities would be a major reason they would consider moving.
Municipality
Municipalities (Across Wayne, Oakland and Macomb Counties)
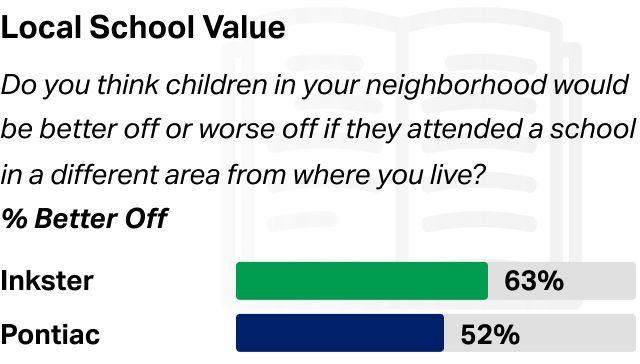
A stark divide in reports of school quality separates municipalities.
Over half of Inkster (63%) and Pontiac (52%) residents believe local children would be better off in schools elsewhere, compared with under 10% in Canton, West Bloomfield and Royal Oak. External data confirm this divide: Standardized test scores in Pontiac (8) and Hamtramck (14) are a fraction of those in Royal Oak (27), Canton (28) and Rochester (31).
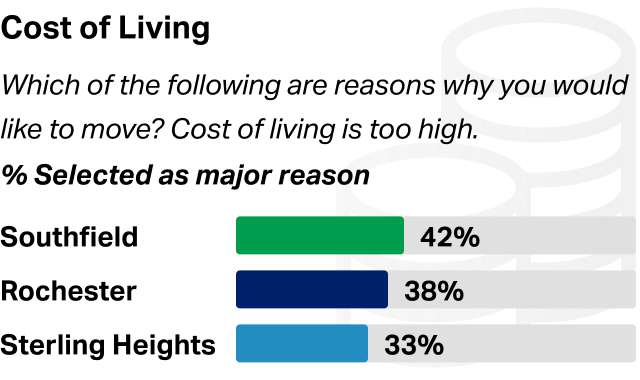
Affordability concerns are widespread.
Cost of living ranks as a top reason to leave, even in Southfield (42%), Rochester (38%) and Sterling Heights (33%), suggesting affordability pressure is a regional issue, not just a Detroit-specific one. External data provide context: Median home sale prices in these cities range from $206,000 (Southfield) to $436,000 (Rochester), and median household incomes — while higher than Detroit's $40,000 — still leave many residents stretched, particularly in Southfield ($66,000) and Sterling Heights ($78,000).
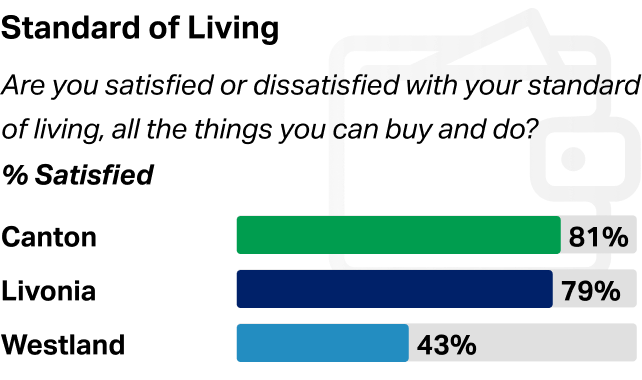
Satisfaction with standard of living varies sharply.
In Livonia (79%) and Canton (81%), about eight in 10 residents say they are satisfied with their standard of living, but this drops to just 43% in neighboring Westland.
Neighborhood
Neighborhoods Within Detroit
Quality Healthcare Access
How easy or difficult is it to access the following in the area where you live? High-quality healthcare
2.79 - Mt. Olivet Lowest rating among all neighborhoods, on a five-point scale, where 5 is very easy and 1 very difficult.
Access to quality healthcare varies and correlates to the presence of healthcare offices.
Residents’ perceptions of the ease of accessing quality care varies across neighborhoods. In Indian Village, residents report care as being much easier to access compared with those in Mt. Olivet (average of 3.99 vs. 2.79). External data confirm a stark difference between the two neighborhoods in the number of healthcare offices: Indian Village has 28 healthcare offices or hospitals, compared with Mt. Olivet’s nine.
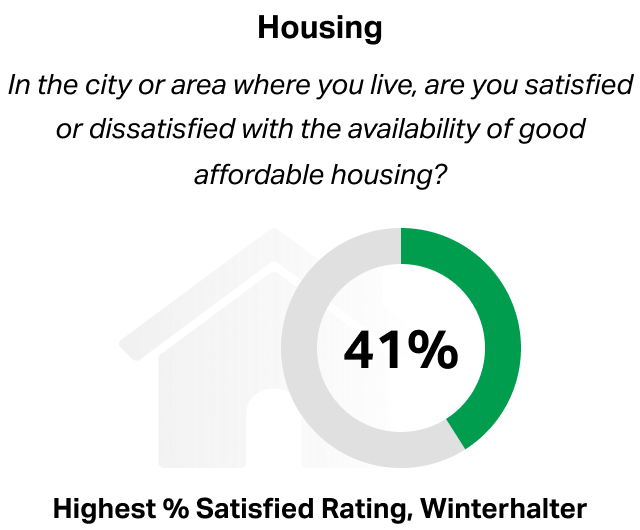
Satisfaction with housing affordability is uniformly low across Detroit neighborhoods.
Satisfaction ranges from roughly 15% to 45% across most areas, with little variation — pointing to a structural, citywide problem rather than isolated neighborhood conditions. External data confirm this structural pattern: Median home sale prices across Detroit neighborhoods span a wide range — from under $50,000 to over $375,000 — yet reported satisfaction is consistently low regardless of price point, suggesting the problem is driven by income constraints rather than price levels alone. Median household incomes across most residential neighborhoods fall between $28,000 and $60,000.
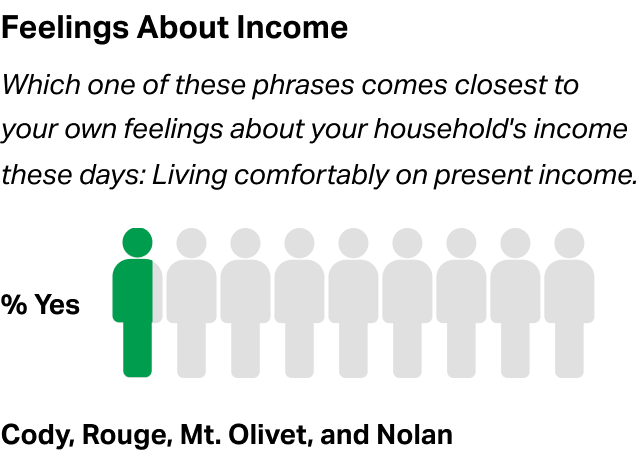
Financial comfort is rare in most Detroit neighborhoods.
In Cody, Rouge, Mt. Olivet and Nolan, fewer than one in 10 residents report being financially comfortable, reflecting concentrated material hardship across much of the city. External data confirm these conditions: Poverty rates in these four neighborhoods range from 30% to 38%, median household incomes range from $36,000 to $40,000, and unemployment rates range from 14% to 16%.
This research was made possible through support from the following organizations.





Download Past Detroit Regional Chamber – Gallup Reports
-
Detroit Resident Voices Survey Report
Subscribe to Our Research
Sign up to receive email updates about our latest global analytics work, including insights from our survey research and polling around the world.