![CS Meta Analysis 2018 > Hero Card > 2026-06 [UPDATE]](https://imagekit.gallup.com/fusion/tr:n-emd_tmpl_dlp_bg_lg/CSFCMSEN/85b5c8f4-2f73-472f-961d-2c68fdcee3db.jpg)
The Effect of CliftonStrengths 34 Feedback on Employee Engagement and Sales
This Gallup meta-analysis — the second edition in Gallup's CliftonStrengths research series — examines whether employees gain more from learning all 34 of their CliftonStrengths themes or just their top five, drawing on 34 studies across 30 organizations, 187,291 individuals, 13 industries and 37 countries.
Building on Gallup's landmark 2016 strengths meta-analysis, the report quantifies the incremental impact of full CliftonStrengths 34 feedback on two of the most consequential business outcomes: a 7.8% increase in sales and measurable gains across nearly every Q12 employee engagement item, with the largest lift on Q03 — having the opportunity to do what you do best every day.
Whether you're a CHRO weighing the ROI of expanded strengths feedback, an L&D leader designing a coaching program or a Gallup-Certified Strengths Coach guiding clients through their full profile, this report delivers the evidence and benchmarks needed to confidently invest in CliftonStrengths 34 over a top-five-only approach.
Executive Summary
Executive Summary
In prior research studies, Gallup researchers have shown that strengths-based employee development leads to more engaging and productive workplaces. The purpose of this study is to refine those findings by examining the variability in the organizational benefits that may be attributable to the type of feedback that employees receive. Specifically, this study examines the incremental benefits of receiving feedback on all 34 CliftonStrengths themes, compared with feedback on one's top five themes.
This follow-up to Gallup's 2016 strengths meta-analysis further examines the relationship between strengths-based development and business performance outcomes, comparing the relative merits of two different types of feedback.
We accumulated 34 research studies across 30 organizations in 13 industries and 37 countries. Within each study, we statistically calculated the relationships between strengths-based interventions and performance outcomes that the organizations supplied. In total, we were able to study 187,291 individuals. We collected data on six outcomes: sales, employee engagement, customer engagement, turnover, performance ratings and safety (accidents). The engagement and sales data are reported in detail because we had ample data to examine them thoroughly. The data provided for the other performance outcomes were more limited, so they are discussed briefly and should be considered preliminary.
The employee engagement data used in this study were pulled from our client database and constitute one large sample that was analyzed directly. The data for all other outcomes are from multiple studies; accordingly, meta-analytic techniques were applied to these data to produce generalizable results.
Individual studies often contain small sample sizes and idiosyncrasies that distort the interpretation of results. Meta-analysis is a statistical technique that is useful in combining results of studies with seemingly disparate findings. This technique corrects for sampling error, measurement error and other study artifacts to determine the true relationship with greater precision. We applied Hunter-Schmidt meta-analysis methods to 34 research studies to estimate the true relationship between strengths-based interventions and each performance measure, and to test for generalizability. For each of the meta-analytic results, we then examined the practical meaning of the relationships by conducting a utility analysis.
As shown in previous studies (Asplund, Harter, Agrawal, & Plowman, 2016), strengths-based development is related to each performance outcome we examined. For all outcomes, these relationships are stronger for employees or work units who received more extensive feedback — feedback on all 34 CliftonStrengths themes rather than just their top five themes.
Results indicate high generalizability, which means the direction of the effects of the strengths-based development interventions were consistent across different organizations.
The following are the mean observed net effects of 34-theme feedback above the effects observed with five-theme feedback:
-
Sales: 7.8%
-
Employee Engagement: +0.08 basis points on GrandMean (the equally weighted mean of all Q12 items)
The relationship between strengths-based employee development and performance at the individual and work-unit levels is substantial and generalizable across organizations. This means that practitioners can apply strengths-based employee development in a variety of situations with confidence that these interventions capture important performance-related information. This study also shows that those practitioners will have a substantially greater likelihood of success when they provide feedback on all 34 CliftonStrengths themes.
Introduction
Introduction
Gallup has investigated the nature of human talents and strengths for more than 50 years. These investigations resulted in the CliftonStrengths assessment, an online evaluation that identifies individual areas of talent in which a person has the greatest potential for building strengths. The assessment's supporting materials help people discover how to develop their talents into strengths.
Strengths development proceeds from the "identification of positive personal and interpersonal traits (talents) in order to position and develop individuals to increase the frequency of positive subjective experience" (Clifton & Harter, 2003). The approach suggests that people can develop most efficiently through their natural talents by integrating knowledge and skills with natural talents, rather than attempting to fix weak or missing traits.
Gallup defines strengths as activities for which one can provide consistent, near-perfect performance. Skills, knowledge and talents — along with the time spent (i.e., investment) practicing, developing skills and building a knowledge base — combine to create strengths.
-
Skills represent the ability to perform the fundamental steps of specific tasks, such as driving a forklift. Skills are not naturally recurring; one must acquire them through formal or informal training and practice.
-
Knowledge is an acquaintance with, and understanding of, facts and principles accumulated through education or experience.
-
Talents are natural ways of thinking, feeling and behaving, such as an inner drive to compete, sensitivity to the needs of others or the tendency to be outgoing at social gatherings. Talents come into existence naturally and are less likely to be acquired like skills and knowledge are.
Our most powerful talents represent our best opportunities to perform at levels of excellence. Dominant talents naturally appear frequently and powerfully in a variety of situations. They can take the form of yearnings or areas of rapid learning. They can be areas of great personal satisfaction or areas in which one experiences a sense of timelessness.
-
A yearning can be described as an internal force that leads one to a particular activity or environment time and again.
-
Rapid learning reveals talent through the speed at which one anticipates the steps of a new activity, acquires a new skill or gains new knowledge.
-
Satisfaction is a positive emotional response to successfully meeting challenges that engage one's greatest talents. These energizing experiences are often evidence of a dominant talent at work.
-
Timelessness also can serve as a clue to talent. Being engaged in an activity at a deep, natural level can result in a lack of the sense of time passing. This indicates a level of engrossment in that activity that is consistent with a deep natural talent (Csikszentmihalyi, 1997).
Dominant talents naturally appear frequently and powerfully in a variety of situations. Individuals can develop a heightened self-awareness or add knowledge and skills to develop those talents into strengths. The more an individual exercises a talent and refines it through added knowledge and skills, the more integrated and stronger it becomes. Then they can consider it a strength. Individuals who can identify and develop a heightened self-awareness of their strengths will be more likely to leverage their positive attributes and achieve higher success than will those who do not have a self-awareness of what they do well or those who focus on improving areas of lesser aptitude (Hodges & Asplund, 2009).
Following the identification of strengths is the integration of the strengths into one's self-view. Changes in one's perceived sense of self have been found to be enduring turning points in one's life (Avolio & Luthans, 2006). Ultimately, the change in an individual's perceived sense of self helps the person interpret the situation and context around them through a different lens and, thus, leads toward changed behaviors and improved performance at work (Clifton & Harter, 2003).
In programs designed to promote strengths-based development, feedback is often accompanied by instruction, experiential learning and mentoring activities designed to help people develop strengths associated with occupational or educational roles. The intended use of CliftonStrengths is to facilitate the personal development and growth of an individual, specifically self-discovery (Asplund, Agrawal, Hodges, Harter, & Lopez, 2014; Hodges & Asplund, 2009). The results are a preliminary hypothesis of that individual's strengths and should be verified and confirmed based on the individual's understanding of self.
The CliftonStrengths assessment identifies an individual's most- and least-natural talent themes, or categories of talents, which are recurring and consistent patterns of thought, feeling or behavior. Assessment results provide a list of 34 distinct themes, placing the most dominant themes at the top. Respondents also receive detailed information about each theme and developmental suggestions to help the individual turn their talents into strengths. For more information on the development of the CliftonStrengths assessment, please see The Clifton StrengthsFinder® 2.0 Technical Report: Development and Validation.
Historically, most respondents have received feedback on only their top five themes, rather than the full set of 34 themes. Gallup focused on the top five themes for several reasons:
-
CliftonStrengths was designed explicitly to help people develop dominant talents into strengths.
-
As an initial hypothesis, Gallup researchers believed that most individuals could work on developing five talent themes. This format was well-received, and people made great progress in developing their top talents into strengths, so Gallup continued to research the effectiveness of that format in most cases.
-
Gallup researchers and leaders believed that respondents would need coaches to help them assimilate the large quantity of information in a full profile of 34 themes and that most respondents would not have access to coaches.
-
Employees and students already received significant feedback on their nontalents and weaknesses from other sources.
-
People were reporting meaningful improvements in their lives as a result of the feedback they received on their top five themes.
Although the majority of individuals who have taken the assessment have received feedback on their top five, a sizable minority population has chosen to receive feedback on all 34 of their talent themes. Recipients of the full list of 34 themes often have been executives — people with significant leadership responsibilities and relatively little time to manage their own strengths development — at Gallup client organizations, and with few exceptions, these individuals review the additional feedback with a Gallup-Certified Strengths Coach. Nonexecutives and other individuals interested in their personal and professional development also have received coaching on their full theme profile.
Over time, the coaches have observed great improvement in these individuals' abilities to capitalize on the additional feedback. When comparing coaching clients who received feedback on their top five themes with those receiving feedback on all 34 themes, the coaches discovered that "full-profile" clients excelled not only at developing their top talents into strengths, but also at managing the talents that are not dominant for them. It is important to note that these two types of feedback represent no difference in philosophy in terms of how to approach one's development. For decades, Gallup has postulated that people should focus on their strengths first and then learn to manage the areas that are not as likely to develop into strengths. Both approaches start with this same overarching approach to development. The 34-theme approach creates awareness for tendencies that are less likely to become strengths.
Just as our top CliftonStrengths describe who we are, those at the bottom often reveal considerations about who we are not. They are not necessarily weaknesses, but they are our least-powerful themes. If they are not managed properly, they can prevent us from maximizing our potential and then become weaknesses. In the opinions of our most experienced coaches, accessing and examining the bottom themes were worthwhile and beneficial actions for their clients.
We have received similar feedback from those who invested in their development by exploring their full profile of 34 themes without the assistance of a coach. Although we still believe that a coach is required to fully capitalize on the information contained in a full strengths profile, we have come to understand that many individuals can extract significant value from their list of 34 themes and the related feedback on their own.
Knowing that many have experienced great benefits from receiving feedback beyond their top five, this study is an attempt to estimate the added value of knowing and applying information from one's full profile of 34 themes.
Methods
Methods
A meta-analysis is a statistical integration of data accumulated across many different studies. Meta-analysis has the potential to provide uniquely powerful information because it accounts for measurement and sampling errors and other idiosyncrasies that distort the results of individual studies. A meta-analysis eliminates biases and provides an estimate of true validity or true relationship between two or more variables. Statistics typically calculated during meta-analyses also allow the researcher to explore the presence, or lack, of moderators of relationships. It provides a method by which researchers can determine whether validities and relationships generalize across various situations (e.g., across firms or geographical locations). For the present analysis, we used the Hunter-Schmidt method's random effects model meta-analysis methods (Schmidt & Hunter, 2014).
Meta-analyses can be conducted on cumulative studies of the relationships between two or more variables or of the impact of two-group experimental interventions. The former are generally meta-analyses of r values, whereas the latter are meta-analyses of d values (the difference between treatment and control groups divided by the pooled standard deviation). Meta-analytic mathematics, which use advanced statistical methods such as reliability and range restriction distributions, are much more amenable to the use of r values than d values. Since d values can be directly transformed into point-biserial r values, and vice versa, it is generally most analytically efficient to convert d values into r values, conduct the meta-analysis and then convert the true score r values back into d values for interpretative purposes. We used that process for this study.
For this meta-analysis, we corrected for artifactual sources of variation such as sampling error, measurement error and range restriction, where possible. We also corrected for measurement error in most dependent variables based on artifact distributions obtained for previous Gallup meta-analyses. We used test-retest reliability estimates based on Scenario 23 in Schmidt and Hunter (1996). Scenario 23 takes into account that some change in dependent variables (stability) is a function of real change.
The most basic definition of a Gallup strengths-based intervention is one in which respondents complete the CliftonStrengths assessment to become aware of their top natural talents and then develop their strengths. In practice, strengths-based interventions vary in objective, type and magnitude. In some cases, respondents are given more advanced coaching and training, and in other cases, they are given more basic information such as a book or website description and tutorial. Some organizations implement interventions for the benefit of managers of teams, while other organizations provide interventions to develop individual contributors.
Gallup researchers accumulated research studies that examined the effects of strengths-based interventions on two groups:
-
Individuals or work units who received feedback on their top five CliftonStrengths themes
-
Individuals or work units who received feedback on all 34 CliftonStrengths themes
These studies included randomized experimental designs, as well as quasi-experimental designs using wait list control groups. Where possible, we hypothesized variables that could explain possible differences between nonrandomized treatments. We also used control groups based on various specific factors (e.g., demographics, baseline engagement, geography, trade area market statistics, tenure, job type). In previous studies of this type (Asplund, Harter, Agrawal, & Plowman, 2016), the evidence argues for the use of appropriate control variables to improve model specification.
We identified six general dependent variables across our studies: sales, employee engagement, customer engagement, turnover, performance ratings and safety (accidents). The following is a description of each dependent variable:
-
Sales: Account growth, sales as a percentage of quota, new accounts, same-store sales and margin growth, revenue per customer, sales, and margin as a percentage of goal; these outcomes were available for work units or teams
-
Employee Engagement: Individual-level average scores on Gallup's Q12 instrument
-
Customer Engagement: Customer perceptions of the quality of service; available for work units or teams
-
Turnover: Individual employee terminations
-
Performance Ratings: Supervisory performance ratings or performance appraisals; these outcomes were aggregated for work units or teams
-
Safety (Accidents): Hours lost to injury; these outcomes were available for work units or teams
In an exhaustive review of Gallup's inferential databases, we accumulated data from organizations with both CliftonStrengths data and performance data. Researchers limited their scrutiny to organizations that have a minimum of 30 complete CliftonStrengths responses and detailed information on the type of strengths feedback. We removed a few organizations from the study due to lack of identifiable contrast groups.
We assembled an initial pool of 34 studies from 30 organizations for analysis. Only one organization supplied safety data, so we removed that organization. After further scrutiny, we removed 11 additional studies due to methodological concerns.
Four studies were available with customer engagement data, and one of those studies supplied nearly 80% of the study units. In all four studies, work units receiving feedback on all 34 CliftonStrengths themes had much better performance, resulting in a true validity of 0.25. The sales and engagement studies provided much-higher-quality results, so we chose to defer further investigation into customer engagement to a later date when we may have more data.
Two small studies were available with employee turnover data, and in one of those studies, only nine employees met the treatment criterion of having received feedback on all 34 CliftonStrengths themes. Therefore, we did not conduct analysis on turnover.
Only five studies included performance rating data. As with the customer data, all of these studies showed a significant positive relationship between performance ratings and receiving feedback on all 34 CliftonStrengths themes (true validity equals 0.17). But one of the five studies supplied more than 94% of the study units. Given the superior characteristics of the engagement and sales data, we chose to defer further meta-analytic investigation of performance ratings to a later date when we may have more data.
In the end, we included a total of 22 studies in 23 organizations, including 115,614 individuals — 21 studies included sales data and were included in a work-unit-level meta-analysis, and one large, combined, individual-level study was conducted with employee engagement as the outcome.
The study organizations came from a wide range of industries, including vehicle manufacturing, computers, retail and commercial banking, mass retail, finance and insurance, healthcare, aerospace, food and agriculture products, oil services, automobile retail, investment services, education, and consumer products.
The total study population was geographically diverse as well, with individuals and work units from 37 countries. The number of countries per study ranged from one to 34.
We followed these steps when conducting the sales meta-analysis:
-
Convert d values from experimental and quasi-experimental studies to r values.
-
Conduct meta-analyses using artifact distributions, reporting observed and true score effect sizes, standard deviations, and generalizability statistics.
-
Convert r values back to d value effect sizes.
-
Conduct utility analysis to estimate the practical value of the effect size estimates of the various intervention-outcome combinations.
The analysis of employee engagement data was much less complex. We extracted all cases from Gallup's database of employee engagement data. Each case that we used for this study met the following conditions:
-
The employee's organization had a minimum of 30 complete CliftonStrengths responses. This criterion increased the likelihood of having a sufficient sample in both treatment and contrast groups.
-
Strengths feedback had been provided to the employee, and the details of that feedback could be verified in Gallup's strengths database.
-
Measures of the employee's engagement were available for periods of both before and after the employee received strengths feedback. Engagement cohorts were held constant so that each organization's pre-CliftonStrengths measure was the organization's first, and each post-CliftonStrengths measure was the organization's second. This approach limited the cohort effects among organizations with multiple engagement measures.
After extracting data that met all criteria, we had a data set containing 23,640 employees from 22 organizations. Each organization had employees who received each type of strengths feedback: The total receiving feedback on all 34 talent themes was 16,231, and the remaining 7,409 received feedback only on their top five.
Expectations, Hypotheses and Results
Expectations, Hypotheses and Results
In practice, organizations have used strengths interventions to overcome an array of specific organizational challenges or as part of a much larger transformation of workplace culture (Hodges & Asplund, 2009). These applications generally have been motivated by the idea that learning and developing our greatest strengths will help us work more productively. Previous studies have provided evidence of increases in employee effectiveness due to strengths interventions.
This study is an attempt to determine whether the greater investment of time and resources involved in receiving feedback on all 34 talent themes provides commensurate increases in benefits to the respondent. More than just an increase in information, the additional feedback on all 34 themes is qualitatively different in that lower-ranked themes are generally not as relevant in our daily lives, nor are they aspects of our lives that are likely to improve significantly if we invest in improving them.
Hypothesis 1: Individuals and work units who received feedback on all 34 of their talent themes will have higher engagement and performance than will comparable individuals and work units who received feedback on only their top five themes.
Hypothesis 2: The superior benefits of feedback on all 34 talent themes will generalize across organizations. There will be few, if any, organizations with zero effect sizes or those in the opposite direction of Hypothesis 1.
Sales
The results of the sales meta-analysis support both research hypotheses. Meta-analytic and validity generalization statistics for these relationships are below.
Sales Meta-Analysis Statistics
| Metric | Sales |
|---|---|
| Number of units | 10592 |
| Number of r's | 21 |
| Mean observed r | 0.062 |
| Observed SDr | 0.055 |
| Mean observed d | 0.12 |
| True validity r | 0.067 |
| True validity SD | 0.034 |
| True validity d | 0.13 |
| % Variance accounted for — sampling error | 65.4 |
| % Variance accounted for | 67.9 |
| 90% CVr | 0.024 |
| 90% CVd | 0.05 |
Mean observed correlations and standard deviations are shown, followed by estimated true validities, after correcting for dependent variable measurement error and within-organization range restriction. The range-restriction correction places all organizations on the same basis in terms of variability in the independent variable. One can review these results as estimating the relationships across individuals or work units within the average organization.
The findings show generalizability across organizations, as indicated by the 90% credibility values, all of which match the direction of the hypothesized relationships. That is, receiving feedback on all 34 talent themes provides greater benefits to the individual or work unit regardless of organization, industry and country. Study artifacts explain most of the variance in correlations among the sales studies — 67.9% of the variance in correlations is attributable to sampling error, range variation or measurement error.
Employee Engagement
The results of the engagement study also support both research hypotheses. Compared with employees and work units who received details about their top five talent themes, employees and work units who received details on all 34 themes improved more on all but one engagement item (Q10: having a best friend at work). Of note, Q10 realized the largest overall gain (0.50 with top-five feedback and 0.49 with 34-theme feedback) regardless of the type of strengths intervention.
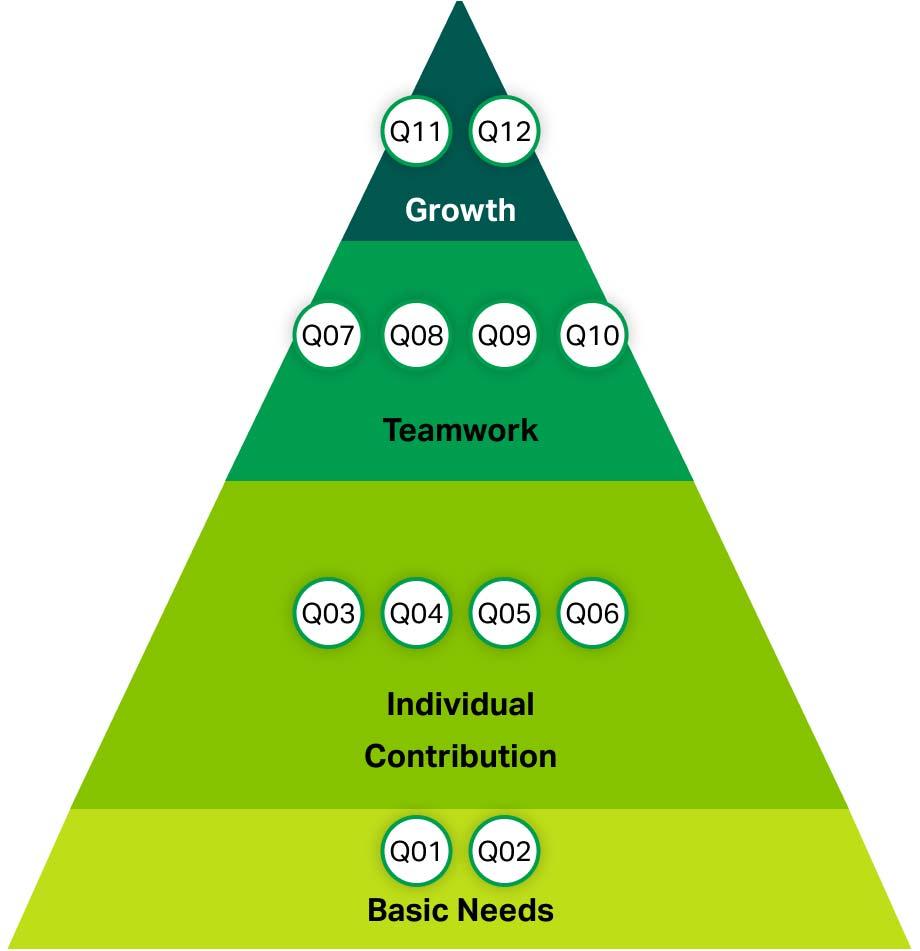
- Q12. Opportunities at work to learn and grow
- Q11. Talked about progress in last six months
- Q10. Best friend at work
- Q09. Associates/fellow employees committed to quality
- Q08. Mission/purpose of company
- Q07. At work, my opinions seem to count
- Q06. Someone at work encourages my development
- Q05. Supervisor/someone at work cares
- Q04. Recognition last seven days
- Q03. Do what I do best every day
- Q02. Materials and equipment I need
- Q01. I know what is expected of me at work
Utility Analysis: Practicality of the Effects
Utility Analysis: Practicality of the Effects
The practical implications of this study have been estimated by employing utility analysis methods (Schmidt & Rauschenberger, 1986). The utility estimates for the sales and employee engagement outcomes are included in the table below, and they represent differences with appreciable practical significance.
Given that effect sizes varied, depending somewhat on whether control variables were used, we were conservative in our estimations of practical utility. We produced a range of likely utility estimates based on the 10th percentile (90% credibility value) of true score effects and the mean observed effect size. We estimated variability of outcomes based on both literature and Gallup database values.
The estimated incremental increases in employee engagement shown in Table 3 are substantial and indicate one of the likeliest pathways whereby strengths feedback improves financial performance (Asplund & Blacksmith, 2011). These differences relate to substantial gains in the many performance outcomes that are associated with engagement improvement, as shown in Estimating Net Gain in Performance From Changes in Employee Engagement (Gallup, 2016).
This meta-analysis is the first comprehensive study comparing the organizational benefits of two types of strengths interventions. The findings reinforce earlier evidence that interventions can be developed and used across different types of organizations with a high level of confidence, and that these investments in employee development can provide material benefits to the organization. This study also shows that providing more comprehensive CliftonStrengths feedback is likely to generate more significant benefits.
The utility analyses demonstrate that the observed effects have important practical implications. Many researchers have observed that investments in employee development produce significant, measurable benefits for the employee and the organization. One practical example that affects millions of employees is provided by examining performance management. Many companies lack a straightforward and decisive approach to managing and incentivizing performance (Flade, Harter, & Asplund, 2014; Fleming & Asplund, 2007). In discussing the flaws inherent in the way organizations conduct performance management, Wigert and Harter (2017) noted that only two in 10 employees strongly agree their performance is managed in a way that motivates them to do outstanding work. They go on to describe how modernizing performance management involves, among other things, individualizing performance to each person. Effectively managing individual employees requires an authentic relationship grounded in an understanding of each employee. Strengths-based management enables this more individualized approach by helping the manager match key job demands to what each employee does best. A strengths-based approach also helps improve the odds that performance conversations will become opportunities for constructive development and, ultimately, a more positive experience for both the employee and the manager.
With respect to their daily performance, employees have significantly greater potential for growth in areas of great talent than areas of nontalent. The fundamental role of managers is to be a catalyst in enabling their people to achieve outstanding performance now and in the future. Employees come to work and give their best for managers who care about them as a person, and strengths-based feedback helps managers demonstrate they care by highlighting areas where the employee has the opportunity to do their best every day.
We have heard from strengths coaches that their clients have an appetite for more extensive feedback and advice than many of them have received by reviewing their top five talents. This study indicates that the provision of more extensive feedback results in a stronger relationship between the employee and the employer: Scores on all but one of the employee engagement items increase more after receiving feedback on all 34 talent themes versus the top five. The item that improved the most was Q03 (At work, I have the opportunity to do what I do best every day), which implies that providing more extensive feedback helps employees develop a more refined understanding of what they do best or a better understanding of how their strengths fit their daily responsibilities — or both.
Strengths formation is a developmental process that occurs over time. It is likely that the formation never stops but, rather, slows significantly and becomes more of a sharpening process as we age. Each of us is the product of countless choices and influences, and continued adaptations take place against the backdrop of earlier influences. Accordingly, we get more return on investment when working on areas of talent, but this study demonstrates that it is also beneficial to receive feedback — through a Gallup-Certified Strengths Coach or Gallup's recently updated CliftonStrengths 34 report — on areas of lesser talent.
It is important to note that, while we observed some benefits of learning one's lesser talents in this study, those benefits occurred in interventions that focused primarily on developing strengths. We know that focusing on strengths reduces stress (Asplund, 2012) and helps build hope, self-efficacy, and appreciation and understanding of others (Stubblefield, Soria, & Snyder, 2014). Strengths conversations enable more open and constructive relationships between the employee and a coach or manager, including discussions about managing lesser talents.
References & Acknowledgements
References & Acknowledgements
To date, the evidence from numerous organizational studies suggests that strengths-based employee development leads to more engaging and productive workplaces. The purpose of this study was to apply meta-analysis to a collection of research studies on strengths-based development and examine evidence of generalizability.
- Jim Asplund, M.A.
- James K. Harter, Ph.D.
- Sangeeta Agrawal, M.S.
- Stephanie K. Plowman, M.A.
- Asplund, J. (2012). When Americans use their strengths more, they stress less. Gallup. Retrieved from http://www.gallup.com/poll/157679/americans-strengths-stress-less.aspx
- Asplund, J., Agrawal, S., Hodges, T., Harter, J., & Lopez, S. J. (2014). The Clifton StrengthsFinder® 2.0 technical report: Development and validation. The Gallup Organization.
- Asplund, J., & Blacksmith, N. (2011). Productivity through strengths. In K. C. Cameron, & G. M. Spreitzer (Eds.), Oxford Handbook of Positive Organizational Scholarship. Oxford University Press.
- Asplund, J., Harter, J., Agrawal, S., & Plowman, S. (2016). The relationship between strengths-based employee development and organizational outcomes. The Gallup Organization.
- Avolio, B. J., & Luthans, F. (2006). The high impact leader: Moments matter in accelerating authentic leadership development. New York: McGraw-Hill.
- Clifton, D. O., & Harter, J. K. (2003). Strengths investment. In K. S. Cameron, J. E. Dutton, & R. E. Quinn (Eds.), Positive Organizational Scholarship: Foundations of a New Discipline. (pp. 111-121). San Francisco: Berrett-Koehler Publishers, Inc.
- Csikszentmihalyi, M. (1997). Creativity: Flow and the psychology of discovery and invention. New York: Harper Perennial.
- Flade, P., Harter, J., & Asplund, J. (2014). Seven things great employers do (that others don't). Harvard Business Review. Retrieved from https://hbr.org/2014/04/seven-things-great-employers-do-that-others-dont/
- Fleming, J. H., & Asplund, J. (2007). Human sigma: Managing the employee-customer encounter. New York: Gallup Press.
- Gallup. (2016). Estimating net gain in performance from changes in employee engagement.
- Hodges, T. D., & Asplund, J. (2009). Strengths development in the workplace. In P. A. Linley, S. Harrington, & N. Page. (Eds.), Oxford Handbook of Positive Psychology and Work. Oxford University Press.
- Schmidt, F. L., & Hunter, J. E. (1996). Measurement error in psychological research: Lessons from 26 research scenarios. Psychological Methods, 1(2), 199-223.
- Schmidt, F. L., & Hunter, J. E. (2014). Methods of meta-analysis: Correcting error and bias in research findings (3rd ed.). Thousand Oaks, CA: SAGE Publications, Inc.
- Schmidt, F. L., & Rauschenberger, J. (1986, April). Utility analysis for practitioners. Paper presented at the first annual conference of The Society for Industrial and Organizational Psychology, Chicago, IL.
- Stubblefield, R., Soria, K., & Snyder, S. (2014). Strengths at the U: Building a strengths-based undergraduate experience. University of Minnesota.
- Wigert, B., & Harter, J. (2017). Re-engineering performance management. Gallup.
The authors thank Jim Harter, Daniela Yu, Stephanie Plowman and Lisa Brehm for contributing important research studies, performance data and database information.
Get This Report Via Email
We will send you a copy of this full report and updates about our latest global analytics research and polling.