Story Highlights
- A majority in U.S. say they are spending more on groceries, 55%
- Consumer spending on gasoline is way down from last year
- Not as much spending on consumer electronics, leisure activities
PRINCETON, N.J. -- A majority of Americans, 55%, say they are spending more than they did last year on groceries, the area in which Americans continually report spending more.
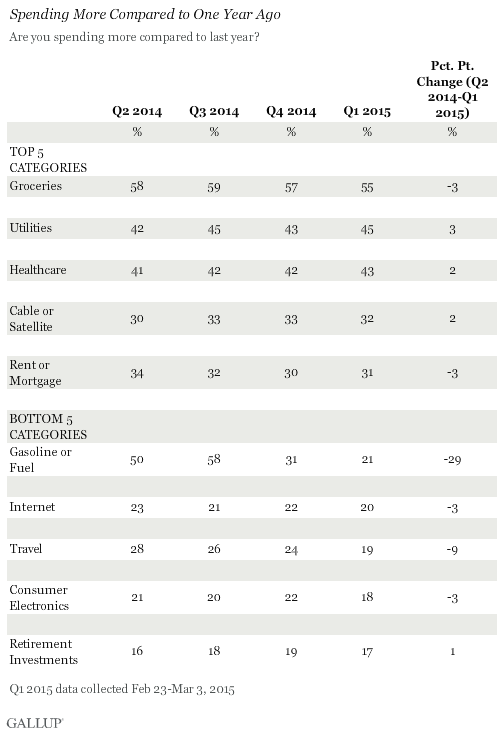
Since last June, the top three categories with the highest percentages of consumers saying they are "spending more" (groceries, utilities and healthcare) have stayed in the top five. Of these, only groceries showed a modest decline in the percentage of Americans saying they are spending more (three percentage points), while utilities and healthcare both inched up slightly (three points and two points, respectively). None of these changes, however, are statistically significant.
Consistent with the steep decline in gas prices over the past year, the only category to show a major shift in spending is "gasoline or fuel," in which 21% of Americans in March said they were spending more, compared with 50% in June 2014. Thirteen percent said they were spending less on gas last June compared with 55% this March. The net spending difference has shifted from +37 (spending more minus spending less) to -34.
Over the past nine months, there has been a general but modest decline in net spending across almost all spending categories, driven by a decreasing number of Americans saying they are spending more on each category. The exceptions to this general trend are leisure activities (+3), cable or satellite (+4), utilities (+5) and healthcare (+3), areas where more Americans say they are spending more than a year ago and fewer say they are spending less.
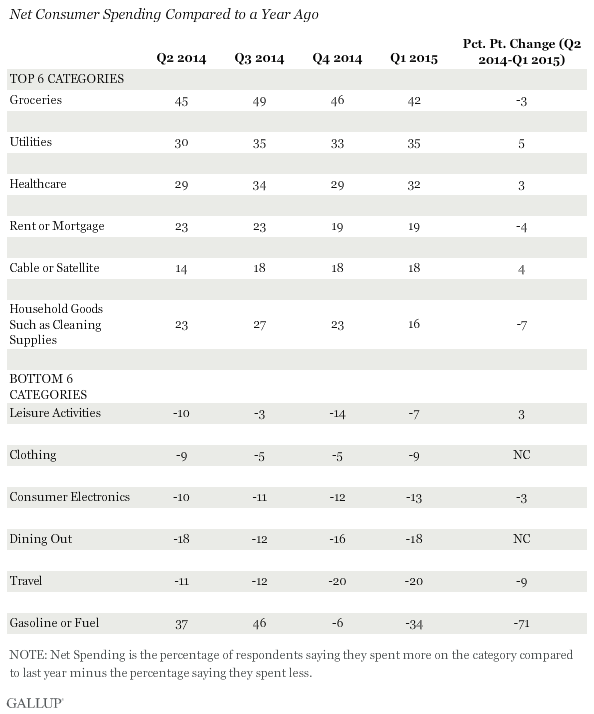
Americans continue to spend more on things they need, but not on things they want. All five categories of discretionary purchases -- leisure activities, clothing, consumer electronics, dining out and travel -- continue to have negative net spending with substantially more Americans saying they are spending less than last year than those who say they are spending more. As household essentials claim a larger slice of Americans' spending, less remains for discretionary purchases.
These data suggest that at least some of the money that is not being spent on gas is going into discretionary spending categories -- leisure activities and dining out -- which either showed an increase in net spending or showed a modest increase in the percentage of those saying they are spending more today than a year ago. But some of the money that Americans are not spending on gas is going to other non-discretionary categories -- cable or satellite, utilities and healthcare. These three categories were among the four to show increases in net spending over the past nine months.
Americans may be letting their gas savings remain in their bank accounts or perhaps moving those funds into savings accounts -- rather than actively redirecting them to other areas of spending. Of course, other uses for this gas-driven windfall are possible too.
Implications
After nine months of following Americans' self-reported spending patterns, several conclusions seem warranted. First, net spending -- the percentage of Americans reporting that they are spending more within a category minus the percentage saying they are spending less -- seems to be fairly stable for all categories except gas or fuel. This could be attributable, in part, to the possibility that self-reports of spending may be less sensitive to actual spending fluctuations than to dramatic shifts in spending, such as the change in spending on gasoline. People may simply be inclined to overlook smaller spending changes when they discuss it. Second, gas prices have actually declined precipitously over the past nine months, and this decline is clearly reflected in Americans' perceptions of their spending. Third, net spending appears to be on a modest downward trend with the percentage of Americans reporting that they are spending more within a category and the percentage saying they are spending less moving closer together. Finally, the overall order of the spending categories based on net spending hasn't changed much since Gallup began measuring spending in this way. Three of the top four net spending categories back in June 2014 -- groceries, utilities and healthcare -- all remain at the top. Four of the bottom five net spending categories remain at the bottom -- travel, dining out, consumer electronics and clothing.
As the summer travel season begins, it will be interesting to see whether American consumers report spending more on gas and whether they say they are spending more on travel and leisure activities.
Survey Methods
Results for this Gallup poll are based on telephone interviews conducted Feb. 23-March 3, 2015, with a random sample of 1,525 adults, aged 18 and older, living in all 50 U.S. states and the District of Columbia. For results based on the total sample of national adults, the margin of sampling error is ±2.5 percentage points at the 95% confidence level. For comparisons between or within the total sample for each generation, the margin of sampling error is ±5.9 percentage points at the 95% confidence level.
Each sample of national adults includes a minimum quota of 50% cellphone respondents and 50% landline respondents, with additional minimum quotas by time zone within region. Landline and cellular telephone numbers are selected using random-digit-dial methods.