


skip to main content
CS and Team Experiences > Top Card
Report

CliftonStrengths® and Team Experiences: Insights on Trust, Collaboration and Manager Impact

Gallup surveyed thousands of people who have completed the CliftonStrengths assessment to examine what experiences make the best and worst teams. Explore the insights to learn how managers influence those experiences and how people’s CliftonStrengths shape what people notice and value about trust, collaboration, results, innovation and other aspects of their teams.

About this research: The findings in this report are based on two Gallup surveys of individuals who have previously completed the CliftonStrengths assessment, fielded in the second and fourth quarters of 2025, along with findings from Gallup's 2025 fourth quarter Gallup PanelTM workforce study and a Gallup meta-analysis of team strengths, engagement and performance (Harter et al., 2016). The 2025 second quarter recontact survey included 3,645 respondents overall, with best- and worst-team findings based on 3,341 respondents. The 2025 fourth quarter recontact survey included 3,888 respondents overall, with conflict-related findings based on 3,630 respondents.

See full methodology arrow

Calendar icon Report Released: August 2026
Rotating arrows icon Last Updated: August 2026

Executive Summary

Two people can work on the same team, report to the same manager and still experience different impressions of how well that team is functioning. These different perceptions of team culture are shaped by each person’s natural talents and dominant ways of thinking, feeling and behaving.

Drawing on Gallup’s meta-analytic research and two large-scale surveys with individuals who had completed the CliftonStrengths assessment, this report examines how people’s strengths shape their perceptions of their best and worst team experiences, conflict, and interactions with their managers.

Key Findings

  1. The best team experiences are defined by trust, collaboration and meaningful contribution.

    Individuals with different leading CliftonStrengths domains and talent themes consistently said their best teams were those where people trusted one another, collaborated effectively, and contributed to meaningful or impactful work. Open-ended responses reinforced these experiences. The strongest team experiences were marked by commitment and dedication, trust and respect, and effective collaboration and teamwork. People remember their best teams not only because they achieved results, but also because the team worked well together while doing work that mattered.

  2. The worst teams are remembered for relationship breakdowns more than task failures.

    The most frequently selected reasons for dysfunctional teams were lacking trust and strong relationships, struggling to collaborate effectively as a team, and failing to recognize or value teammates’ contributions. When respondents described their most dysfunctional, or worst, team experiences, the most common themes were poor leadership, lack of collaboration and teamwork, lack of communication, toxic culture, and trust issues. Poor team experiences are often less about isolated performance problems and more about the breakdown of trust, communication and mutual respect.

  3. Individuals’ natural talents shape what they notice and value in team experiences.

    People who lead with different CliftonStrengths themes often emphasized different aspects of their best and worst teams:

    • Respondents who lead with Executing themes were more likely than those who lead with other themes to emphasize deadline-related aspects of strong teams.

    • Those who lead with Influencing themes were more likely to emphasize a variety of factors related to relationships and idea generation.

    • Respondents who lead with Relationship Building themes were more likely to emphasize trust, recognition and collaboration.

    • Those who lead with Strategic Thinking themes were more likely to emphasize creativity and future-oriented thinking.

  4. Perceptions about the type of conflict on teams were similar across people who lead with different strengths domains.

    When respondents indicated the type of conflict that happens on their teams, patterns were generally consistent across those with different leading CliftonStrengths domains. However, people’s natural talents — their tendencies in how they think, feel and behave — can influence how team members interpret conflict, what they notice first during conflict and how they prefer to work through tension. For teams, the opportunity in conflict is to use CliftonStrengths as a common language for understanding different approaches, communication styles and expectations.

  5. Managers play a defining role in whether teams thrive or break down.

    Respondents described their best managers as those who provide support, trust and autonomy, empathy, clear communication, leadership, fairness, recognition, and innovation. Respondents described their worst managers as micromanaging, arrogant, poor at leadership and communication, unavailable, unfair, and lacking empathy and trust.

The Current State of Teams

Key takeaway

The landscape of team-based work is changing quickly. Teams in the workplace today are larger, more distributed and more complex than they were in the past, making strengths awareness more important than ever. Gallup research has identified several workplace trends and experiences that are reshaping how employees collaborate, communicate and connect within their teams.

Team Sizes Are Growing

The average U.S. team has grown by nearly 50% since 2013, from about eight direct reports per manager to 12. Median team size has remained fairly steady over the same time period, with about five to six employees per manager or leader, indicating that the largest teams are the ones getting bigger.

placeholder

Gallup’s research shows how employee engagement translates into business outcomes across different team sizes, revealing that there is no single best team size that applies across every organization or industry for maximizing engagement and performance. In a 2026 meta-analysis of 92,252 teams of different sizes, Gallup researchers found that higher engagement is linked to increased productivity, increased wellbeing and lower turnover for small teams of four to nine employees and medium teams of 10 to 19 employees. For large teams of 20 or more employees, engagement is positively associated with higher wellbeing, but the relationship between engagement, productivity and turnover varies by industry.

A team’s industry, type of work (i.e., individual contributor vs. manager responsibilities) and managerial talent influence how a manager can turn engagement into stronger team performance. Managers need support from their leaders, clear operational systems and strong development tools to maintain connection, coordination and accountability as their span of control grows.

Connection Is Weak

Recent Gallup research on team effectiveness from a Gallup PanelTM workforce study in the fourth quarter of 20251 shows that many employees are still missing the basic conditions that help teams work well together. Across several dimensions of team quality, including clarity, belonging and continuous improvement, fewer than half of U.S. employees indicate their teams are getting these fundamentals right:

41%of employees strongly agree they know what their coworkers are expected to do

37%strongly agree they feel like part of their team

25% strongly agree their team takes time to reflect on and discuss how they can make things better

Many teams are missing the everyday conditions that make teamwork feel clear, connected and intentional. Without shared expectations, a strong sense of belonging and regular reflection on how to improve, teams may struggle to coordinate work, build trust and reach their goals.

1 See the Methodology section for study details.

Hybrid and Remote Work Add Complexity

Although some organizations have adopted best practices for different work arrangements, many teams still struggle to build trust, establish expectations, collaborate well and manage effectively across work locations.

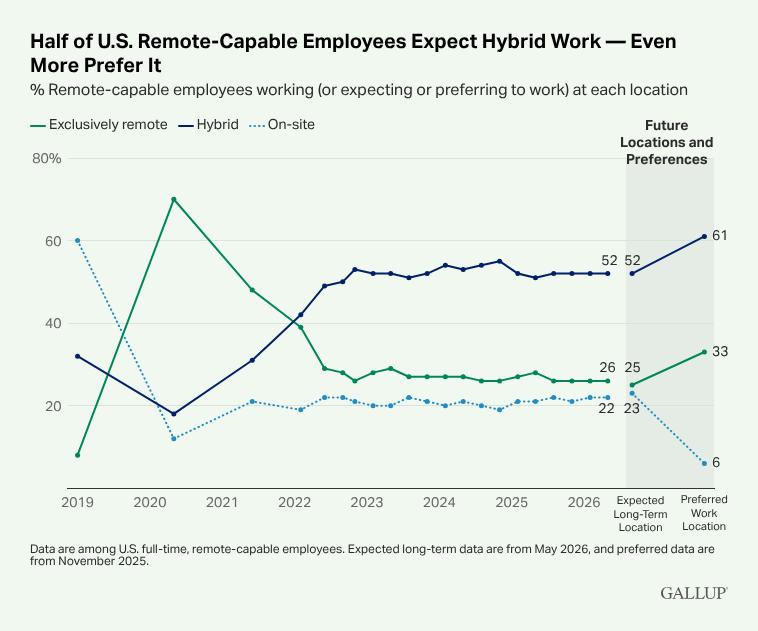
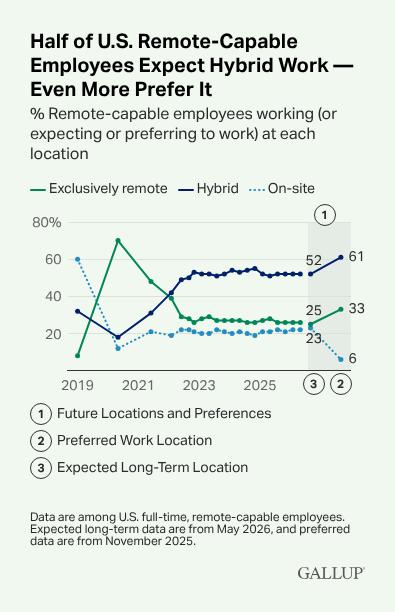
As of May 2026, 52% of U.S. full-time, remote-capable employees work in a hybrid work arrangement, 26% work exclusively remotely and 22% work on-site. Employees’ expected long-term locations suggest that hybrid flexibility is likely to continue: 52% expect to continue working in a hybrid arrangement, 25% expect to work remotely and 23% expect to work on-site in the long term.

Half of U.S. Remote-Capable Employees Expect Hybrid Work — Even More Prefer It

Disruption Disproportionately Affects Leaders

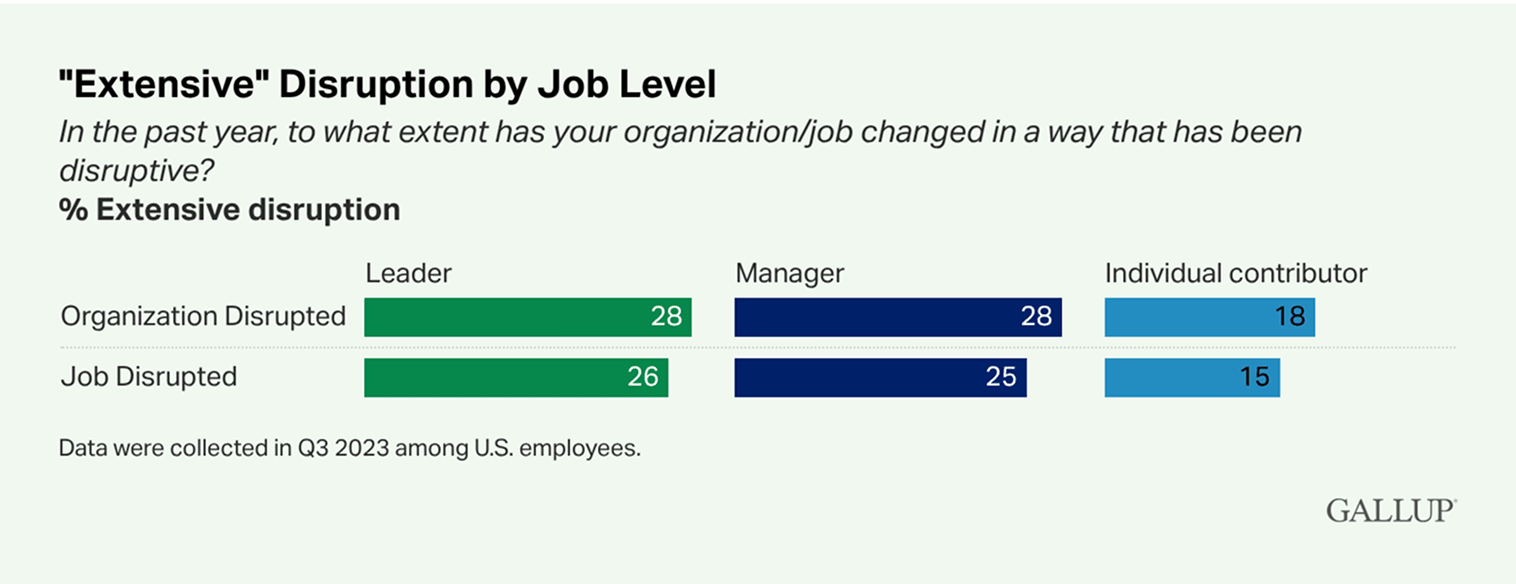
In today’s workplaces, leaders and managers are expected to help employees navigate uncertainty while experiencing greater levels of disruption themselves. Gallup finds that leaders and managers are 56% more likely than individual contributors to report experiencing extensive disruptive change in their organization. When leaders are stretched by ongoing disruption, their ability to provide clarity, support and direction to their teams can become strained.

"Extensive" Disruption by Job Level

AI Use Is Increasing and Changing How Teams Work

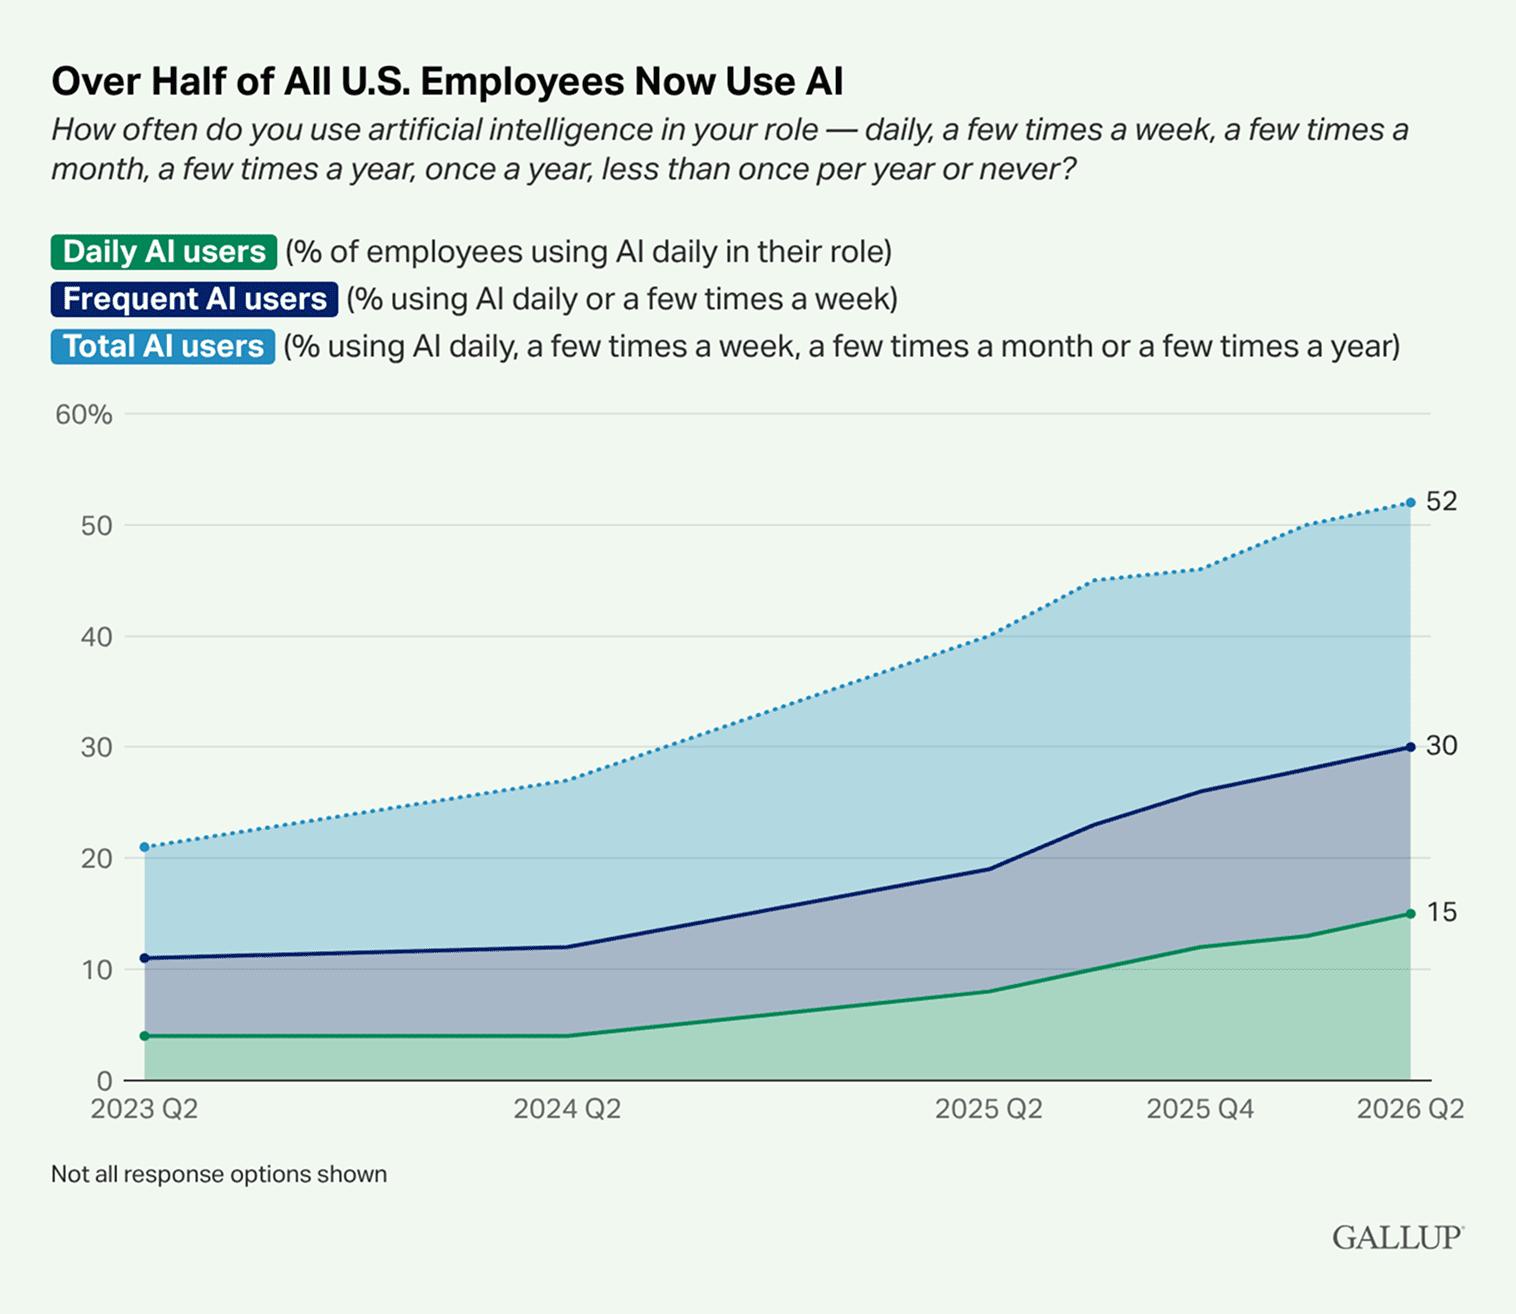
For the first time since Gallup began measuring employee use of artificial intelligence (AI), more than half of employed U.S. adults, 52%, say they use AI in their roles at least a few times a year, as of the second quarter of 2026.

"Over Half of All U.S. Employees Now Use AI

While 65% of employees in organizations implementing AI say it has improved their productivity and efficiency, only 12% strongly agree that AI has transformed how work gets done in their organization, as of the first quarter of 2026.

For teams, AI use creates a new coordination challenge. AI may help individuals complete tasks more efficiently, but many teams have yet to agree on how to use AI and integrate it into their shared expectations and workflows.

Matrixed Teams Require Flexibility and Introduce Unique Challenges

Matrixed teams, in which employees work across multiple teams, projects or leaders, aim to collaborate effectively and work with agility to reach team and organizational goals. Gallup identifies several types of matrixed employees:

  • slightly matrixed employees who sometimes work on multiple teams with people who may or may not report to the same manager

  • manager-matrixed employees who work on multiple teams every day, though most team members report to the same manager

  • highly matrixed employees who work daily across teams with people reporting to different managers

about 7 out of 10 people

About seven in 10 employees work across multiple teams at least some of the time.

Gallup research on matrixed teams, based on a 2019 Gallup Panel workforce study of more than 14,000 U.S. employees, found that 72% of employees were working across multiple teams at least some of the time before the pandemic. In a 2025 fourth quarter Gallup Panel workforce study of 22,368 U.S. employees, 69% said they work across multiple teams with different people every day or some days.2

2 See the Methodology section for study details.

What Are the Benefits and Challenges of Matrixed Teams?

Matrixed team structures can create meaningful benefits, including cross-functional collaboration and additional opportunities for development. Matrixed teams work effectively when leaders and managers set clear expectations for roles, priorities, and communication norms and when project managers and people managers work together to provide clarity, feedback, development, and connection opportunities across teams.

At the same time, matrixed work can introduce challenges, including role ambiguity, cognitive overload, meeting fatigue, reduced clarity around responsibilities and project ownership, and inconsistent expectations regarding work location (i.e., on-site, hybrid or remote) and AI use.

Two people facing the same AI-enabled hybrid workplace may have different perspectives about their experiences on that team due to how they interpret guidance from their managers and matrixed team members and whether they value how their team operates. These different perspectives are influenced by their strengths.

Why Strengths Development and Awareness Matter More Than Team Strengths Composition

Key takeaway

For achieving high performance, strengths awareness is more important than the composition of strengths within a team.

Decades of Gallup research have shown that strengths-based development predicts stronger team and business outcomes across industries. In a 2015 meta-analysis of more than 1.2 million employees and about 50,000 business units across 45 countries, work teams that used a strengths-based approach saw significant improvements in organizational key performance indicators, producing:

  • higher employee engagement

  • increased sales and profits

  • better customer engagement

  • fewer safety incidents

  • lower turnover

Depending on the indicator, the gains ranged from modest positive business impact to substantial business improvements, showing that strengths-based development not only creates positive employee experiences, but also supports stronger team and organizational performance.

The Importance of Strengths Awareness Within Teams

A common assumption in strengths-based teams is that the composition of a team’s strengths is more important than team members’ awareness of each other’s strengths. However, in a study of over 11,000 teams across six industries, Gallup found that strengths awareness had twice the influence on a team's performance as the composition of strengths within that team did. In addition, teams in which 90% or more employees know their strengths have substantially higher engagement (Harter et al., 2016).

Strengths awareness creates a common language among team members to help them recognize differences, value those differences and get work done more productively. Therefore, giving teams the insights they need to better understand, appreciate and intentionally apply each person’s strengths is a critical step in building an effective team.

How CliftonStrengths Domains Shape Team Experiences

Key takeaway

People who lead with different CliftonStrengths domains experience and interpret team dynamics differently.

Gallup recontact studies in the second and fourth quarters of 20253 sought to reveal if individuals who lead with different CliftonStrengths domains and themes perceive their team environment differently.

Results showed that differences in people’s leading CliftonStrengths domains shape their perceptions of team experiences.

The fourth quarter survey revealed these differences in how people experience their teams based on the CliftonStrengths domain they lead with:

  • People who lead with the Executing domain were 16% more likely to report that they know what their coworkers are expected to do than those who lead with the Strategic Thinking domain.

  • People who lead with the Influencing domain were 26% more likely to report that they feel like part of their team than those who lead with the Strategic Thinking domain.

  • People who lead with the Relationship Building domain were 11% more likely to say their manager creates an open and trusting environment than respondents who lead with the Executing domain.

  • People who lead with the Relationship Building domain were 10% more likely to report that someone on their team causes a lot of problems than those who lead with the Executing domain.

Practical Perspectives

While Gallup does not know the CliftonStrengths of those who were on each respondent’s team or what their team environments were like beyond the self-report measures on the surveys, the insights that emerged from respondents in our sample, combined with insights from our meta-analytic studies and decades of CliftonStrengths coaching, reinforce that being on the same team does not mean having the same experiences on it. For example:

  • People who lead with the Executing domain may be less inclined to notice relational problems until those issues affect their ability to get work done.
  • People who lead with the Influencing domain may thrive when they have the opportunity to talk through things or exchange ideas with others.
  • People who lead with the Relationship Building domain may be inclined to feel team tension or disconnection earlier than others who are experiencing similar workplace circumstances.
  • People who lead with the Strategic Thinking domain may want time to process ideas independently before jumping into a team discussion.

3 See the Methodology section for study details.

Descriptions of Best and Worst Team Experiences

Key takeaway

People described the experiences on their best teams as including shared commitment, mutual trust and respect, and effective collaboration. The most common descriptions of experiences on individuals’ worst teams were poor leadership, lack of collaboration and ineffective communication.

In the 2025 second quarter CliftonStrengths Recontact Panel survey, respondents reflected on the best and most dysfunctional teams they had ever been a part of across work, school, sports and other settings to reveal what makes teams thrive or break down. In this report, “most dysfunctional team” is labeled as “worst team.”

In response to an open-ended item, respondents described what made their team the best or worst. These verbatim responses were coded into major themes. Percentages below reflect the frequency of each theme across coded open-ended responses.

Table 1. Themes of Verbatim Descriptions of Best and Worst Teams

Best team open-ended item: In a few sentences, or more if you’d like, what makes this team the best team you’ve ever been a part of?

Worst team open-ended item: In a few sentences, or more if you’d like, what made this team the most dysfunctional team you’ve ever been a part of?

Percentages of each theme across coded open-ended responses

Themes About Best Teams
Commitment and Dedication 26
Trust and Respect 21
Collaboration and Teamwork 13
Diversity and Inclusion 9
Open Communication 8
Positive Culture 8
Strong Leadership 6
Autonomy and Empowerment 6
Innovation and Creativity 3
Themes About Worst Teams
Poor Leadership 23
Lack of Collaboration and Teamwork 21
Lack of Communication 15
Toxic Culture 14
Trust Issues 13
Lack of Commitment and Dedication 7
Lack of Autonomy and Micromanagement 3
No Innovation and Creativity 3
No Diversity and Inclusion 1

Note: For responses that included multiple themes, Gallup coded the response based on the first theme mentioned.

Domain Differences in Best and Worst Team Experiences

Key takeaway

The quality of team relationships and collaboration are central to how people define their best and worst team experiences.

Respondents’ answers to two close-ended items revealed nuanced patterns in how people with different leading CliftonStrengths domains and themes described their best and worst teams.

The heatmaps below show the percentage of respondents who lead with each CliftonStrengths domain and respondents overall who selected each characteristic when indicating their best and worst team experiences.

Reasons for Best Team Experiences

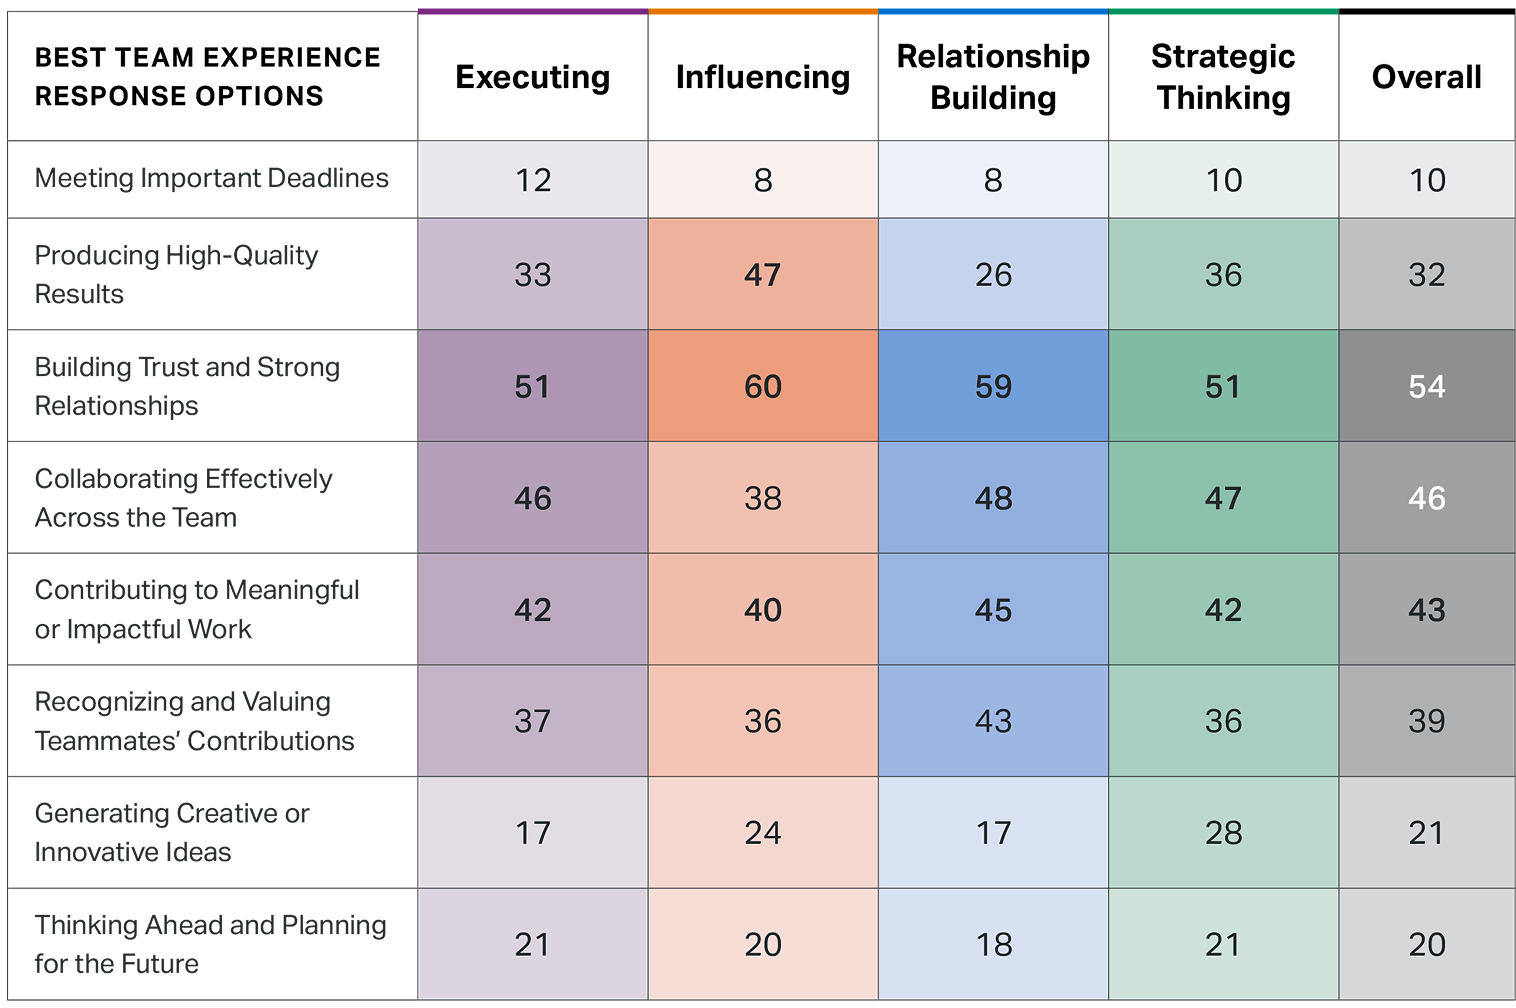
Overview: The most selected reasons that respondents considered a team to be the best were building trust and strong relationships, collaborating effectively across the team, and contributing to meaningful or impactful work. The least selected reason was meeting important deadlines.

Table 2. Best Team Experiences

Best team close-ended item: Which of the following, if any, made this the best team you have ever been on? Select up to three.

% Selected by respondents who lead with each domain and respondents overall

The table titled Best Team Experiences shows percentages of respondents who lead with each CliftonStrengths domain and respondents overall who selected each characteristic when indicating their best team experiences. The four domains include: Executing, Influencing, Relationship Building and Strategic Thinking. The response option Building Trust and Strong Relationships is the top choice in Influencing with 60% and Overall with 54%. Meeting Important Deadlines is least selected across all domains.

Reasons for Worst Team Experiences

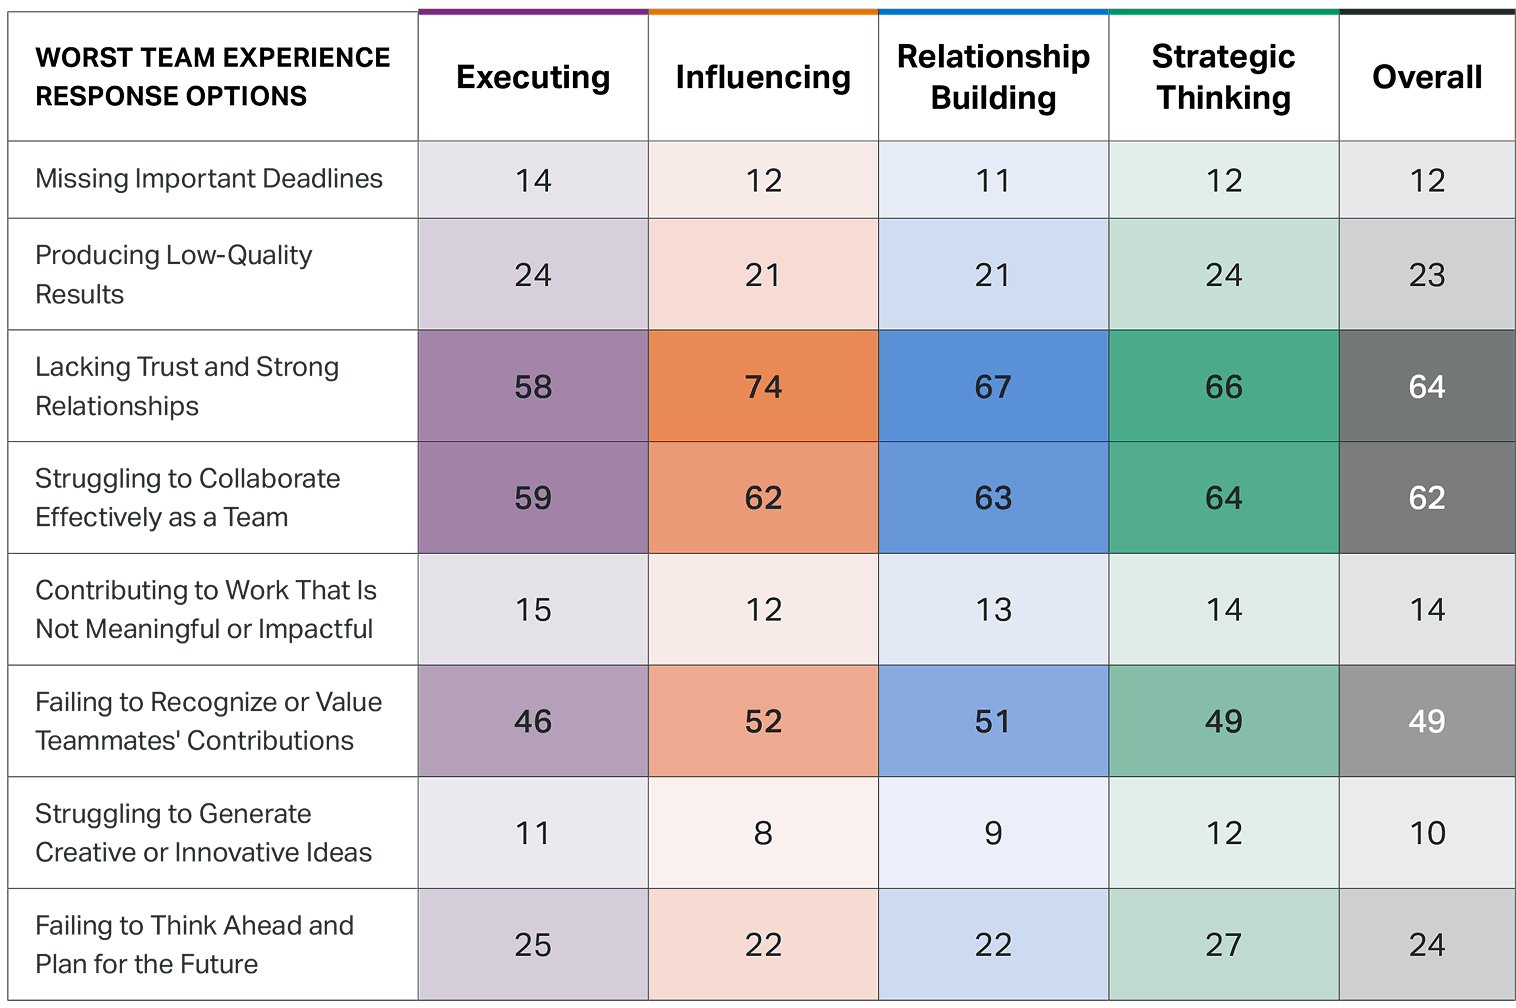
Overview: The most selected reasons that respondents said their team was the worst they have been a part of were lacking trust and strong relationships, struggling to collaborate effectively as a team, and failing to recognize or value teammates’ contributions. The reason selected the least frequently was struggling to generate creative or innovative ideas.

Table 3. Worst Team Experiences

Worst team close-ended item: Which of the following, if any, made this the most dysfunctional team you’ve been a part of? Select up to three.

% Selected by respondents who lead with each domain and respondents overall

The table titled Worst Team Experiences presents data on dysfunctional team experiences across different domains: Executing, Influencing, Relationship Building, Strategic Thinking, and Overall. The response options include Missing Important Deadlines, Producing Low-Quality Results, Lacking Trust and Strong Relationships, Struggling to Collaborate Effectively as a Team, Contributing to Work That Is Not Meaningful or Impactful, Failing to Recognize or Value Teammates’ Contributions, Struggling to Generate Creative or Innovative Ideas, and Failing to Think Ahead and Plan for the Future. The highest percentages are seen in Lacking Trust and Strong Relationships for Influencing at 74 and Overall at 64. Struggling to Collaborate Effectively as a Team is also significant with 62 in Overall, 62 in Influencing and 64 in Strategic Thinking.

Best and Worst Team Experiences, by Domains and Themes

This study explored whether respondents who lead with different CliftonStrengths domains were more or less likely to select certain characteristics of their best and worst teams. These odds ratios, derived from observed point estimates, highlight differences in the likelihood of reporting specific team experiences among respondents based on their leading CliftonStrengths domain. The results across domains show only statistically significant differences (with varying effect sizes).

Additional analyses show the percentage-point difference in selection rates for each response option, comparing respondents who had a specific strength in their top five out of 34 CliftonStrengths themes with respondents who did not have that theme in their top five. Positive values indicate that respondents with the theme were more likely to select the response option, while negative values indicate they were less likely to select it.

Access the detailed results by downloading the full report.

Navigating Team Conflict With a Strengths-Based Perspective

Key takeaway

Reasons for team conflict are fairly consistent across groups of respondents with different leading CliftonStrengths domains. Strengths development gives teams a shared language for understanding and working through tension, whatever the cause.

Conflict is a normal part of teamwork, especially when people care deeply about the same outcomes but approach the work differently. Because a person’s natural talents are the filter through which they perceive their work, their teammates and what "good performance" looks like, differences of opinion, approach or rationale are often expressions of different strengths.

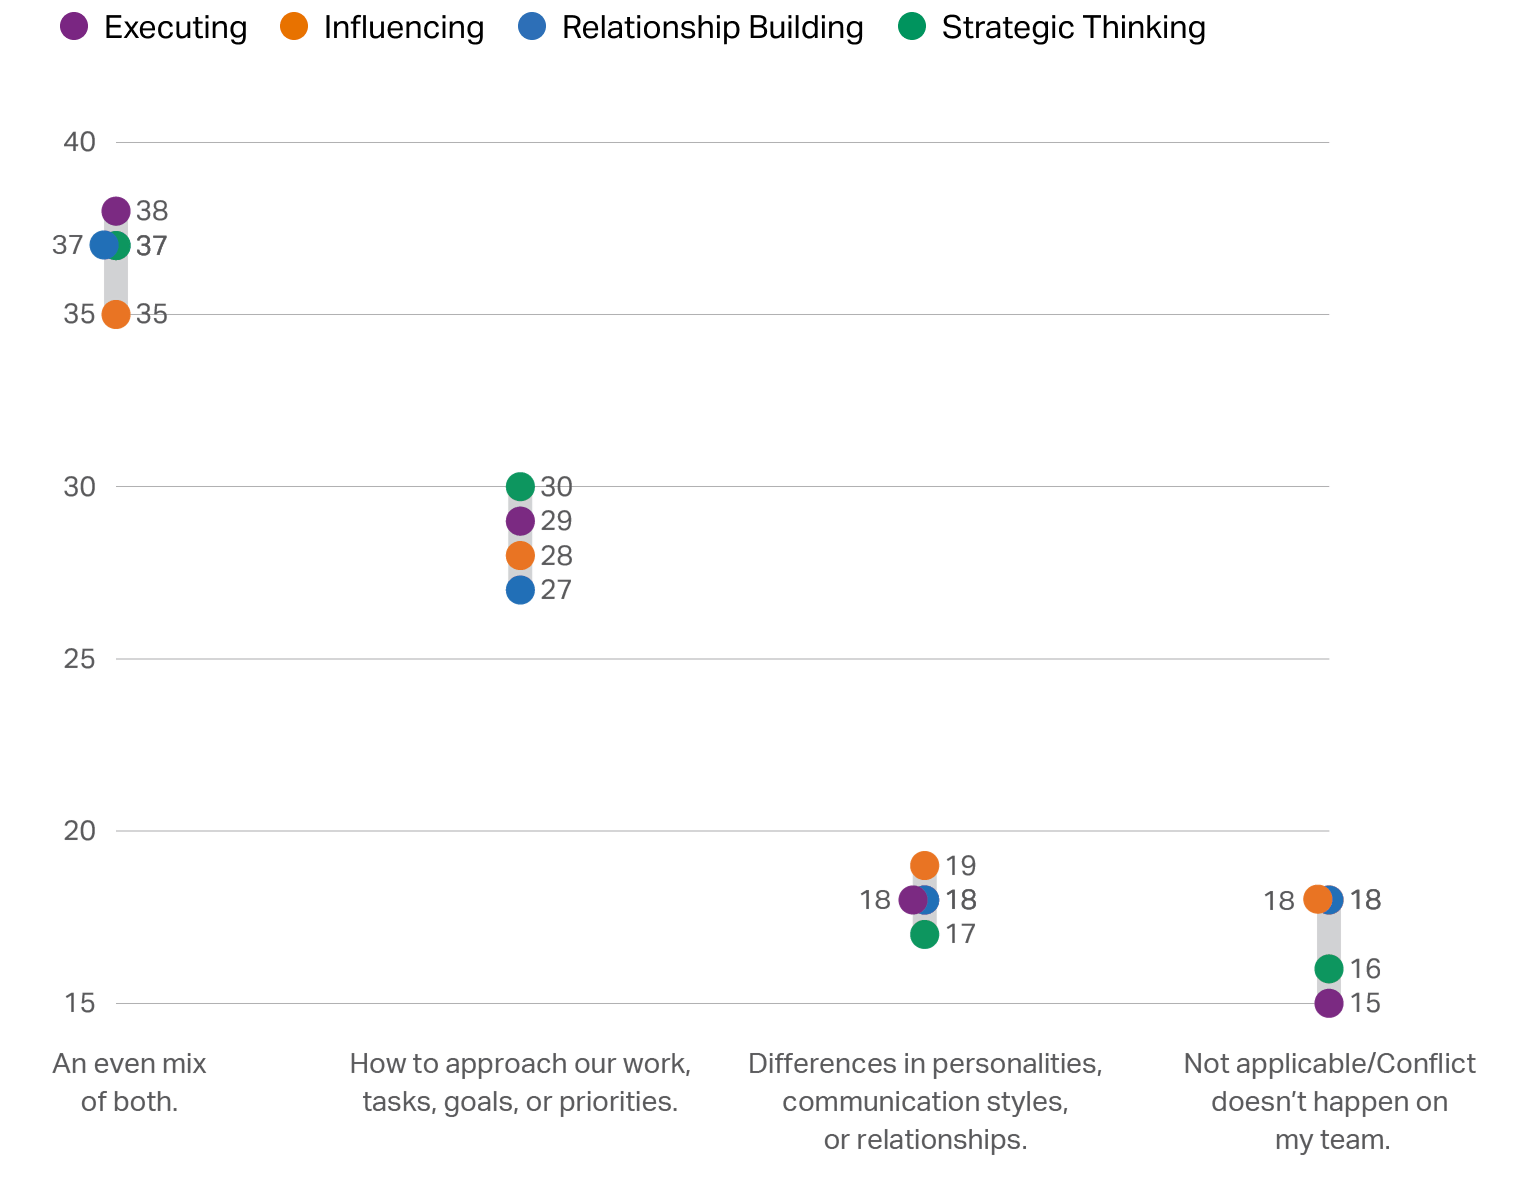
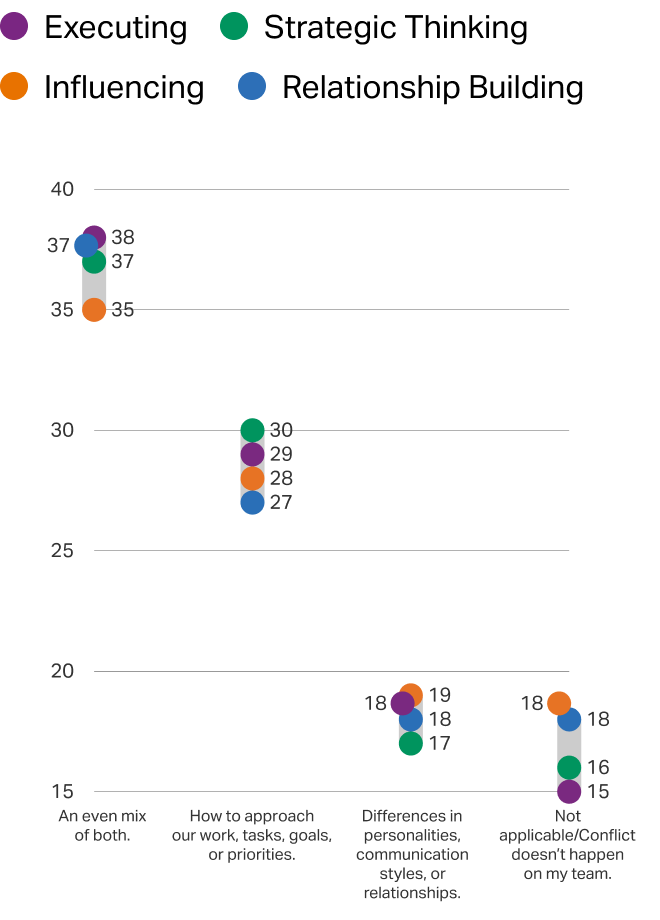
When respondents on the 2025 fourth quarter CliftonStrengths Recontact Panel survey were asked what conflict on their team typically involved, they could indicate that conflict did not occur on their team or that conflict was usually about work approach, tasks, goals or priorities; personality, communication style or relationship differences; or an even mix of both. Across groups of individuals who lead with different CliftonStrengths domains, response patterns were generally consistent, suggesting that the sources of conflict that people experience do not differ substantially by dominant domain. Therefore, strengths awareness and development are not helpful for predicting what teams will clash over. Rather, they give teams a shared language for effectively working through tension once it arises.

Common Sources of Team Conflict

When conflict happens on your team, what does it tend to be about? Select one.

% Selected by respondents who lead with each domain

How Managers Influence Team Experiences

Key takeaway

Across people who lead with different CliftonStrengths domains, respondents tended to describe their best managers in similar ways, suggesting that effective management is grounded in behaviors, not personality fit with the team.

Strong managers create team environments marked by trust, autonomy, support, communication and fairness, while ineffective managers often weaken team experiences through micromanagement, poor communication or lack of empathy.

Effective managers set the tone for how team members perform and collaborate:

  • They define what "quality work" looks like and connect that definition to specific performance standards.

  • They guide team members in the same direction while supporting employees with their day-to-day experiences and challenges.

  • They address breakdowns in collaboration, redistribute work fairly and create opportunities for the team to improve how they operate together.

One strategy for fostering a healthy team mindset and positive team experiences is making strengths-based conversations part of how work gets done. Great managers look for opportunities for team members to develop their strengths in ways that support the team’s goals, and they weave strengths language into everyday conversations about priorities, collaboration, problem-solving and growth.

According to Gallup's span-of-control research published in 2026, an engaged, effective manager can achieve higher team engagement than a disengaged, ineffective manager, regardless of team size, and more talented managers can serve as a buffer against the negative effects of growing teams.

What Employees Say About Their Best and Worst Managers

In the 2025 fourth quarter CliftonStrengths Recontact Panel study, respondents were asked via open-ended items to describe their best and worst managers ever. The open-ended responses were coded into major themes.

Table 4: Best Manager Themes

Best manager open-ended item: Think about the best manager you’ve ever had. What made them the best?

Theme Description
Support and Encouragement Actively backs team members with coaching, resources and advocacy while encouraging growth and confidence
Trust and Autonomy Provides clear goals and guardrails and then trusts members to own the work; does not micromanage
Empathy and Care Sees employees as valued human beings versus interchangeable resources; listens, validates and responds with humanity
Communication and Transparency Communicates expectations honestly and early; maintains open two-way dialogue
Leadership and Inspiration Sets a clear, motivating direction; leads by example
Integrity and Fairness Leads with equity in mind and does not play favorites; shares credit and owns mistakes
Recognition and Appreciation Notices good work, gives meaningful recognition and invests in growth
Problem-Solving and Innovation Approaches challenges with curiosity, invites ideas and supports experimentation

Note: For responses that included multiple themes, Gallup coded the response based on the first theme mentioned.

Table 5: Worst Manager Themes

Worst manager open-ended item: Think about the worst manager you’ve ever had. What made them the worst?

Theme Description
Micromanagement Over-controls through constant monitoring and second-guessing, stripping autonomy
Arrogance and Self-Centeredness Dismisses ideas, hoards credit, deflects blame and uses power to protect ego
Lack of Empathy and Support Dismisses employee needs; responds to challenges with indifference or blame
Poor Leadership and Manager Skills Fails to set direction, make decisions or communicate clearly
Lack of Communication Withholds information; communicates late or only in crisis
Unavailability and Disengagement Physically or psychologically absent; minimally invested
Favoritism and Bias Applies standards unevenly; undermines trust and fairness
Lack of Trust Assumes incompetence; closely monitors and restricts decision-making

Note: For responses that included multiple themes, Gallup coded the response based on the first theme mentioned.

Perceptions of what makes a manager great versus ineffective were strikingly similar among individuals who lead with different CliftonStrengths domains. Across strengths profiles, respondents described many of the same leadership behaviors: clear communication, listening, support, trust and responsiveness. In other words, great management is not defined by a manager’s personality, but by how consistently they show up for their team. How managers communicate, listen and respond shapes whether employees feel equipped to speak up, do their best work and contribute to meeting the team’s goals.

Conclusion: What the Research Means for Teams and Managers

People define their best and most dysfunctional team experiences by how they experience working together rather than by their team structure, goals or mix of talent. Across Gallup studies on team experiences, respondents consistently described their best teams as groups in which people trusted one another, collaborated effectively, communicated clearly and contributed to meaningful work. The worst teams, by contrast, were remembered for breakdowns in leadership, collaboration, communication and trust. Task-related successes and failures regarding meeting deadlines and producing high-quality work were less-dominant characteristics of the best and worst teams.

In summary, people remember team experiences not only based on what their team accomplished, but also based on how the team worked together while achieving its goals.

Examining people’s CliftonStrengths helps explain why teammates may notice, value and respond to their team experiences differently, such as how the team meets deadlines, collaborates, treats each other, recognizes great work and plans for the future. At the same time, the Gallup studies show that despite team members’ leading CliftonStrengths domain, they consistently described great managers as those who demonstrated behaviors that provided support, trust, autonomy, empathy, fairness, clear communication and recognition within their team.

In today’s larger, more distributed and more complex teams, CliftonStrengths gives managers and teams a shared language to understand their differences, navigate tension more productively and create conditions for people to do their best work together.

Recommended

Common Questions About Team Experiences

What Defines the Best Team Experiences?

From Gallup's latest research on the best and worst team experiences, people most frequently indicated that their best team dynamics included trust between team members and from the manager, strong relationships, effective collaboration and meaningful work.

How Do CliftonStrengths Domains Shape Perceptions of Team Experiences?

Gallup has examined the connection between CliftonStrengths domains and the best and worst team experiences. In its studies, respondents who led with the Executing domain were generally more likely than respondents who led with different domains to say the reasons for their best team experiences included task- and results-related aspects of their work, while those who led with the Strategic Thinking domain were generally more likely to emphasize creativity and future-oriented thinking. Respondents who led with the Relationship Building domain were generally more likely to emphasize trust, recognition and collaboration, while those who led with the Influencing domain were generally more likely to emphasize factors regarding relationships and idea generation. These experiences across respondents show that people with different CliftonStrengths perceive their team dynamics differently.

What Causes Team Dysfunction?

Gallup’s research found that when respondents described their most dysfunctional, or worst, team experiences, the most common themes were poor leadership, lack of collaboration and teamwork, lack of communication, toxic culture, and trust issues. In a close-ended survey item asking why a team was the most dysfunctional team they’ve been a part of, the most frequently selected reasons were lacking trust and strong relationships, struggling to collaborate effectively, and failing to recognize or value teammates’ contributions. Respondents also identified why someone was the worst manager they have ever had, and descriptions reflected micromanagement, lack of communication, lack of trust and other factors. Team dysfunction is often less about isolated performance problems and more about the breakdown of trust, communication and mutual respect within a team.

What Manager Behaviors Affect Team Experiences?

Gallup research in 2025 on the best and worst team experiences showed that across respondents with different CliftonStrengths profiles, respondents described great managers in strikingly similar ways that reflected the managers’ behaviors, saying great managers provide support and encouragement, trust and autonomy, empathy and care, communication and transparency, leadership and inspiration, integrity and fairness, recognition and appreciation, and problem-solving and innovation. Great manager behaviors also include core leadership skills that define how to be an effective leader.

Results are based on two recontact surveys conducted in the United States in the second and fourth quarters of 2025 from an opt-in sample of individuals who previously completed the CliftonStrengths assessment and expressed an interest in participating in future Gallup research. Both surveys were fielded in English. Each section of this report is based on a subset of respondents who participated in those 2025 surveys or the other research studies described below.

2025 Second Quarter Recontact Survey

Gallup conducted a survey of 3,645 adults aged 18 or older from the CliftonStrengths Recontact Panel June 3-23, 2025. Respondents answered questions about their best and worst team experiences. Sample sizes for each survey item vary.

Most respondents, 93%, were currently employed for an employer, with 88% working full time for an employer. Fifty-nine percent of respondents are White, 15% are Black, 15% are Hispanic and 7% are Asian. Nearly two-thirds, 65%, are female. Respondents’ average age is 44.7 (SD = 12). Most respondents have a higher education, with 32% holding a postgraduate degree and 28% holding a four-year bachelor's degree. About half of employed respondents, 46%, work mostly on-site, 40% work in a hybrid arrangement and 14% work remotely. A majority of respondents, 52%, are individual contributors, and 25% are managers or supervisors.

Respondents have experience on a variety of teams, including work, class or school, sports or athletic, volunteer or community service, and other (e.g., military, religious, friends, family, etc.). Three-fourths of respondents, 75%, identified a work team as their best type of team, and 70% of respondents said a work team is their worst type of team.

Survey items:

Which of the following, if any, made this the best team you have ever been on? Select up to three.

  • Meeting important deadlines
  • Producing high-quality results
  • Building trust and strong relationships
  • Collaborating effectively across the team
  • Contributing to meaningful or impactful work
  • Recognizing and valuing teammates’ contributions
  • Generating creative or innovative ideas
  • Thinking ahead and planning for the future
  • Other (please specify)
  • None of the above

Which of the following, if any, made this the most dysfunctional team you’ve been a part of? Select up to three.

  • Missing important deadlines
  • Producing low-quality results
  • Lacking trust and strong relationships
  • Struggling to collaborate effectively as a team
  • Contributing to work that is not meaningful or impactful
  • Failing to recognize or value teammates’ contributions
  • Struggling to generate creative or innovative ideas
  • Failing to think ahead and plan for the future
  • Other (please specify)
  • None of the above

Quantitative analyses of the survey items above are based on 3,341 respondents. Margins of sampling error were calculated at the 95% confidence level. Because results are reported overall and by leading CliftonStrengths domain, margins of error vary by subgroup size and response percentage. For domain-level percentages, the margin of sampling error ranges from ±2.9 to ±6.5 percentage points for response percentages around 50% and from ±1.8 to ±3.9 percentage points for response percentages around 10% or 90%. For overall percentages, the margin of sampling error ranges from ±1.6 to ±1.7 percentage points for response percentages around 50% and is ±1.0 percentage point for response percentages around 10% or 90%.

To explore whether best and worst team experiences differed by individual CliftonStrengths themes, Gallup compared the percentage of respondents who selected each multi-select response option and who have a specific theme in their top five with the percentage of respondents who selected each option but did not have that theme in their top five. These results are reported as percentage-point differences. Margins of error were calculated for each percentage-point difference using the sample sizes for the “has theme in top five” and “does not have theme in top five” groups. Because top five theme sample sizes varied, the precision of these estimates also varied. For items related to the best team experiences, margins of error ranged from ±2.4 to ±11.9 percentage points. For items related to the worst team experiences, margins of error ranged from ±2.1 to ±11.9 percentage points. Differences based on smaller theme groups should be interpreted cautiously, and differences that are smaller than or similar to their margin of error should be treated as directional rather than definitive.

2025 Fourth Quarter Recontact Survey

Gallup conducted a survey of 3,888 adults aged 18 or older from the CliftonStrengths Recontact Panel Nov. 10 to Dec. 1, 2025. Respondents answered questions about their current and past best and worst team experiences. Sample sizes for each survey item vary.

Most respondents, 94%, were currently employed for an employer, with 88% working full time. Sixty-four percent of respondents are White, 13% are Hispanic, 12% are Black and 7% are Asian. Nearly two-thirds, 66%, are female. Respondents’ average age is 45 (SD = 13). About one-third of respondents, 32%, hold a postgraduate or professional degree, and 27% hold a four-year bachelor's degree. About two-thirds of respondents, 66%, work mostly on-site, 9% work in a hybrid arrangement and 25% work remotely. A majority of respondents, 51%, are individual contributors, and 25% are managers or supervisors.

Survey item:

When conflict happens on your team, what does it tend to be about? Select one.

  • How to approach our work, tasks, goals or priorities.
  • Differences in personalities, communication styles or relationships.
  • An even mix of both.
  • Not applicable/Conflict doesn’t happen on my team.

Quantitative analyses of the survey item above are based on 3,630 respondents who identified which types of conflict exist in their team. Margins of sampling error were calculated at the 95% confidence level. Because results are reported by leading CliftonStrengths domain, margins of error vary by subgroup size and response percentage. For domain-level percentages, the margin of sampling error ranges from ±4.4 to ±11.0 percentage points.

2025 Fourth Quarter Gallup Panel Workforce Study

The fourth quarter Gallup Panel workforce study was conducted from Oct. 30 to Nov. 14, 2025, among a sample of 22,368 employed U.S. adults. Results are based on self-administered web surveys conducted with a random sample of adults working full time and part time for organizations in the United States, aged 18 and older, who are members of the Gallup Panel. Gallup uses probability-based, random sampling methods to recruit its Panel members.

Gallup weighted the obtained samples to correct for nonresponse. Nonresponse adjustments were made by adjusting the sample to match the national demographics of gender, age, race, Hispanic ethnicity, education and region. Demographic weighting targets were based on the most recent Current Population Survey figures for the aged 18 and older U.S. population.

For results based on the sample of employed U.S. adults, the margin of sampling error at the 95% confidence level is ±1.0 percentage point. In addition to sampling error, question wording and practical challenges in survey administration can introduce error or bias into the findings of public opinion polls.

The survey included items measuring employees’ perceptions of team quality. Results for the team quality items are reported as the percentage of employees who strongly agree with each statement. The survey also included an item asking employees how often they work on multiple teams with different people.

2016 Team Strengths, Engagement and Performance Meta-Analysis

An unpublished team-level strengths meta-analysis conducted by Harter et al. (2016) examined relationships among team strengths, employee engagement and team performance.

The meta-analysis, which had a true validity score of 0.17, included data from six organizations in which 30% or more employees had completed the CliftonStrengths assessment, known as Clifton StrengthsFinder® at the time. The dataset included 11,441 teams across six industries including utilities, electronics manufacturing, pharmaceutical, financial services, retail and medical equipment. The analysis covered employee engagement data and performance outcomes, including financial results and overall performance evaluations for teams.

Reference: Harter, J., Agrawal, S., & Asplund, J. (2016). Team composition: Team strengths, engagement and performance. [Unpublished PowerPoint presentation]. Gallup, Inc.

Copyright © 2000, 2026 Gallup, Inc. All rights reserved. Clifton StrengthsFinder®, CliftonStrengths® and each of the 34 CliftonStrengths theme names are trademarks of Gallup, Inc.

Download the Team Experiences Report

Fill out the form below to get instant access to Gallup’s report on CliftonStrengths and team experiences, including insights on trust, collaboration and manager impact. We will send you a copy of this full report straight to your inbox.

(*) Required

Thank you for your interest!

Click the button to download CliftonStrengths® and Team Experiences: Insights on Trust, Collaboration and Manager Impact.

Get more ideas for using and developing your CliftonStrengths by browsing our latest CliftonStrengths articles, videos, podcast episodes and other resources.