Note: This paper was originally published in August 2004.
Introduction
HumanSigma is the process of improving and reducing variability in the engagement levels of employees and customers. The appellation HumanSigma was not chosen accidentally. HumanSigma, like its namesake Six Sigma, is concerned with reducing variability and improving performance. But, although Six Sigma has focused on variability in processes, systems, and output quality, HumanSigma focuses instead on reducing variability and improving the human aspects of organizational performance to drive positive financial outcomes.
Managers simultaneously manage toward many outcomes. If they focus on increasing revenue today, but do not pay attention to the immediate needs of employees and customers, they will suffer in the long term. Employee and customer engagement are measurable and manageable at a local level (the business unit level). Prior meta-analyses (Harter, Schmidt, & Hayes, 2002; Harter, Schmidt, & Killham, 2003) have established the links between employee engagement and several outcomes (including employee retention, productivity, profitability, safety, and customer loyalty). Research has also indicated the efficacy of customer perceptions of service quality (Schneider, 1991) and customer engagement (Applebaum, 2001) and the possible interactive effect of employee and customer engagement in predicting financials (Fleming & Harter, 2001; Asplund, 2001).
By definition, engagement includes the "involvement and enthusiasm" of employees and the "emotional attachment" of customers. Employees can become "involved and enthusiastic" in their workplaces when they have their basic needs met, have an opportunity to contribute, a sense of belonging, and chances to learn and grow. Customers can become "emotionally attached" to a business unit, its products, services, or brand when they perceive confidence, integrity, pride, and passion in their relationship with that brand. Customers can be influenced by employees and vice versa; however, the causal arrow moves more clearly from the employee to the customer than the reverse (Harter, Asplund, Killham, & Schmidt, 2004).
Gallup client case studies have indicated that, though related, employee and customer engagement account for unique variances in understanding business success or failure. Although prior meta-analyses have established the relationship between employee engagement and customer metrics and employee engagement and financial outcomes, this is the first meta-analysis of the combined relationship (linear combination and interaction) of customer and employee engagement to financial outcomes. The financial outcomes used for this meta-analysis were business unit-level revenue or sales.
Meta-Analysis
A meta-analysis is a statistical integration of data accumulated across many studies. As such, it provides uniquely powerful information because it controls for measurement and sampling errors and other idiosyncrasies that distort the results of individual studies. A meta-analysis eliminates biases and provides an estimate of true validity or true relationship between two or more variables. Statistics typically calculated during meta-analyses also allow us to explore the presence, or absence, of moderators of relationships.
More than 1,000 meta-analyses have been conducted in the psychological, educational, behavioral, medical, and personnel selection fields. The research literature in the behavioral and social sciences includes a multitude of individual studies with apparently conflicting conclusions. Meta-analysis, however, lets us estimate the mean relationship between variables and make corrections for artifactual sources of variation in findings across studies. It provides a method to determine whether validities and relationships generalize across various situations (e.g., across firms or geographical locations).
This is not a full review of meta-analysis. Rather, we encourage readers to consult the following sources for background information and detailed descriptions of the more recent meta-analytic methods: Schmidt (1992); Hunter and Schmidt (1990, 2004); Lipsey and Wilson (1993); Bangert-Drowns (1986); and Schmidt, Hunter, Pearlman, and Rothstein-Hirsh (1985).
Hypothesis and Study Characteristics
The hypotheses examined for this meta-analysis are as follows:
1. At the business unit level, there is a positive and generalizable relationship between:
- employee engagement (EE) and revenue/sales
- customer engagement (CE) and revenue/sales
2. The product of EE and CE is more predictive of revenue/sales than is either EE or CE alone.
3. There is an interaction effect between EE and CE, such that the relationship between EE and revenue/sales is dependent on the level of CE.
4. The relationship between HumanSigma and revenue/sales has substantial practical value to business.
We included 10 independent studies (each for a different company in which Q12 and CE11 were administered) in this meta-analysis -- studies conducted as proprietary research for the respective organizations. In each Q12 or CE11 study, we used all of the Q12 and CE11 items, and data were aggregated at the business unit level and correlated with available revenue or sales data. That is, in these analyses the unit of analysis was the business unit, not the individual employee or customer. The mean of results on the Q12 items defined the measure of employee engagement, and a weighted mean of results on the CE11 items defined the measure of customer engagement. Dependent variables were annual revenue or sales data for each business unit. Within most organizations, business units had differential opportunity for revenue, based on local market, competition, size of operation, and other factors less controllable by the management staff. In an attempt to correct for these local biases, companies often produced goals or quotas they could compare each unit to. Other companies used revenue growth figures (from the prior year). Dependent variables for the 10 studies were as follows: sales growth from the prior year (three studies), sales variance from quota (three studies), actual revenue (two studies), sales per employee, and revenue per transaction (one study each).
We calculated Pearson correlations by estimating the relationship of business unit average measures of employee engagement and customer engagement to business unit revenue or sales. Also, we calculated correlations across business units within each company and entered these correlation coefficients into a database for each independent variable. We then calculated mean correlations, standard deviations of correlations, and validity generalization statistics for each independent variable in relation to the dependent variable (revenue/sales).
Studies for the current meta-analysis were selected so that each company was represented once in each analysis. The studies were categorized as either concurrent (where independent and dependent variables were collected during the same calendar year) or predictive (where the independent variable was collected in year one and the dependent variable in year two). Seven (51% of business units) studies used concurrent and three (49% of business units) used predictive methodology.
The overall study included 67,072 independent employee responses and 214,656 individual customer responses to surveys. It included 1,979 independent business units in 10 companies -- an average of 34 employees and 108 customers per business unit and 198 business units per company. Sample sizes were imbalanced across the studies, with three companies representing the majority of business units available for analysis. For this reason, we used and compared sample-size-weighted and sample-size-unweighted meta-analysis and validity generalization statistics.
Table C-1 provides a summary of studies (per company) organized by industry type. It is evident that there is variation in the industry types represented, as companies from four broad industry categories provided studies. Clearly, the largest number of business units was from retail or financial industries.
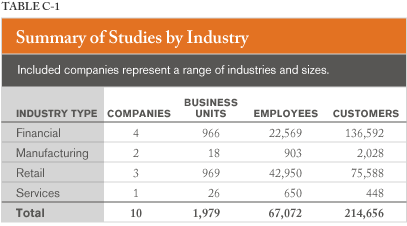 |
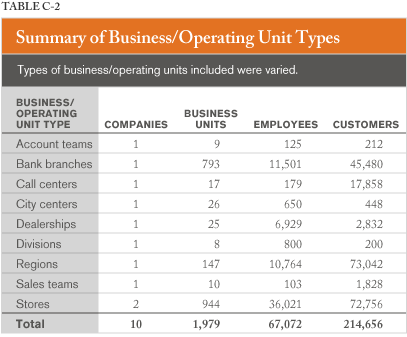
Table C-2 provides a summary of studies (per company) organized by business or operational unit type. There is also considerable variation in type of business unit, ranging from stores to bank branches to regions to call centers. Overall, nine different types of business units are represented; the largest number are stores, branches, and regions.
 |
Meta-Analytic Methods Used
Analyses included weighted and unweighted average correlations, estimates of standard deviation of correlations, and corrections made for sampling error, measurement error in the dependent variables, and range variation and restriction in the independent variables (Q12 and CE11) for these correlations. An additional analysis was conducted, correcting for independent-variable measurement error. The most basic form of meta-analysis corrects variance estimates only for sampling error. Other corrections Hunter and Schmidt (1990, 2004) recommend include correction for measurement and statistical artifacts such as range restriction and measurement error in the performance variables gathered. The sections that follow provide further definition of the above procedures.
We gathered revenue/sales data for multiple time periods to calculate the reliabilities of the business performance measures. Because these multiple measures were not available for each study, we used artifact distributions meta-analysis methods (Hunter & Schmidt, 1990, pp. 158-197) to correct for measurement error in the performance variables. We based the artifact distributions on test-retest reliabilities, where they were available, from various studies. The procedure followed for calculation of business unit outcome-measure reliabilities was consistent with Scenario 23 in Schmidt and Hunter (1996). To take into account that some change in outcomes (stability) is a function of real change, we calculated test-retest reliabilities using the following formula. Test-retest reliability = (r1•2 × r2•3)/r1•3 where r1•2 is the correlation of the outcome measured at time 1 with the same outcome measured at time 2; r2•3 is the correlation of the outcome measured at time 2 with the outcome measured at time 3; and r1•3 is the correlation of the outcome measured at time 1 with the outcome measured at time 3.
This formula factors out real change (which is more likely to occur from time period 1-3 than from time periods 1-2 or 2-3) from random changes in business unit results caused by measurement error, data-collection errors, sampling errors (primarily in customer measures), and uncontrollable fluctuations in outcome measures. We used the artifact distributions derived for financial productivity data from Harter, et al. (2003). The mean test-retest reliability for financial metrics is 0.88.
We could argue that, because the independent variable is used in practice to predict outcomes, the practitioner must live with the reliability of the instrument he or she is using. However, correcting for measurement error in the independent variable answers the theoretical question of how the actual constructs (true scores) relate to each other. For independent-variable reliability estimates, we used artifact distributions reported in Harter, et al. (2003) for employee engagement and customer metrics. Mean test-retest reliabilities are 0.80 and 0.78, respectively. We computed these values in the same manner as we computed for the business unit outcomes.
In correcting for range variation and range restriction, there are fundamental, theoretical questions that need to be considered relating to whether such correction is necessary. In personnel selection, validities are routinely corrected for range restriction because, in selecting applicants for jobs, those scoring highest on the predictor are typically selected. This results in explicit range restriction that biases observed correlations downward (i.e., attenuation). In the employee and customer engagement arena, one could argue that there is no explicit range restriction because we are studying results as they exist in businesses. Business units are not selected based on scores on the predictors (Q12 and CE11 scores).
However, in studying companies, we have observed that there is variation throughout companies in standard deviations of indices across business units. There is also variation in mean scores throughout companies. One hypothesis for why this variation occurs is that companies differ in how they encourage employee and customer engagement initiatives and in how they have or have not developed a common set of values and a common culture (or common perception of "brand," in the case of customer engagement). Therefore, the standard deviation of the population of business units across organizations studied will be greater than the standard deviation within the typical company. Imagine this variation in standard deviations throughout companies as indirect range restriction (as opposed to direct range restriction). We have incorporated recently improved indirect range restriction corrections into this meta-analysis (Hunter, Schmidt, & Le, 2002).
In the past five years, Gallup has collected descriptive data on more than 4 million employee respondents, more than 1 million customer respondents, more than 500,000 business units or workgroups, and more than 400 companies. This accumulation of data indicates that the standard deviation within a given company is, on average, smaller than the standard deviation in the population of all business units. In addition, the ratio of standard deviation for a given company relative to the population value varies from company to company. This is the case for employee and customer engagement measures and somewhat more so for customer engagement. Therefore, if one goal is to estimate the effect size in the population of all business units (arguably a theoretically important issue), then correction should be made based on such available data. In the observed data, correlations are attenuated for companies with less variability across business units than the population average and vice versa. As such, variability in standard deviations throughout companies will create variability in observed correlations and is therefore an artifact that can be corrected for in interpreting the generalizability of validities. The standard deviation for each company was available for employee and customer engagement metrics. As a result, in this meta-analysis we used the actual values observed in the 10 studies for range variation and restriction corrections.
The following excerpt provides an overview of meta-analysis conducted using artifact distributions:
In any given meta-analysis, there may be several artifacts for which artifact information is only sporadically available. . . . For example, suppose measurement error and range restriction are the only relevant artifacts beyond sampling error. In such a case, the typical [artifact distribution-based] meta-analysis is conducted in three stages. First, information is compiled on four distributions: the distribution of the observed correlations, the distribution of the reliability of the independent variable, the distribution of the reliability of the dependent variable, and the distribution of the range departure. That is, there are then four means and four variances compiled from the set of studies, with each study providing whatever information it has. Second, the distribution of [observed] correlations is corrected for sampling error. Third, the distribution corrected for sampling error is then corrected for error of measurement and range variation. (Hunter & Schmidt, 1990, p. 158)
In this study, we calculated and reported statistics at each level of analysis, starting with the observed correlations and then correcting for sampling error, measurement error, and, finally, range variation and range restriction. As alluded to, we have applied the indirect range restriction correction procedure to this meta-analysis (Hunter, et al., 2002).
We also computed the amount of variance predicted for weighted correlations based on sampling error. The following is the formula to calculate variance expected from sampling error in bare-bones meta-analyses, using the Hunter/Schmidt technique:
|
|
We calculated residual standard deviations by subtracting the amount of variance due to sampling error, study differences in measurement error in the dependent variable, and study differences in range variation from the observed variance. To estimate the true validity standard deviations, we adjusted the residual standard deviation for bias due to mean unreliability and mean range restriction. We divided the amount of variance due to sampling error, measurement error, and range variation by the observed variance to calculate the total percentage variance accounted for. One rule of thumb adopted from the literature is that if more than 75% of variance in validities across studies is to the result of sampling error and other artifacts, the validity is assumed generalizable.
In addition to calculating meta-analytic statistics for the relationships between employee engagement and revenue, and customer engagement and revenue, we conducted a meta-analysis of the relationship of the product (EE × CE) to revenue. In part, we used the meta-analysis of the product to understand the interactive effects of employee and customer engagement (Hypothesis 2). We used hierarchical regression to test for the hypothesized interaction between employee and customer engagement. To conduct the analysis, we performed the following steps:
1. We developed a meta-analytic correlation matrix of employee engagement, customer engagement, their product (EE × CE), and revenue. We developed this matrix for business units within companies (without correction for range restriction) and for business units across companies (with correction for range restriction).
2. We used the meta-analytic correlation matrix to conduct standardized regression analyses, as follows:
a. We entered the main effects -- employee and customer engagement -- at steps 1 and 2.
b. We entered the interaction term (EE × CE) at step 3. Thus, the variance due to the main effects was partialed out, allowing for variance due to the interaction term to be observed (Cohen, Cohen, West, & Aiken, 2003).
c. We examined the incremental change in the multiple correlation (DR) from the main effects model to the model including the interaction term (relative to the standard error of Multiple R) in assessing the significance of the interaction.
Results
Table C-3 provides the meta-analysis statistics for the three variables studied (employee engagement, customer engagement, and EE × CE); weighted and unweighted observed statistics are included. Weighted and unweighted observed effect sizes indicate positive (and generalizable) relationships between EE and CE in predicting revenue (Hypothesis 1). The correlation of the product (EE × CE) is more strongly related to revenue than either independent variable alone (the weighted observed effect size is 58% larger; Hypothesis 2). After correcting for criterion reliability, the mean effect size ( r1) is 0.13 for employee and customer engagement. The correlation of the product to revenue is 0.20 (54% larger). However, after correcting for range restriction (which provides an estimate of the effect size across business units and companies), the correlation of the product (EE × CE) does not surpass that of customer engagement to revenue. This is because the range of CE within the typical company is restricted at a higher level than is employee engagement. This could be due to a customer brand effect somewhat muting the range within companies, and thus accentuating it throughout companies. The values depicted in Table C-3 as r1 are the practical effect size we would expect within any company. Those depicted as r2 are the theoretical relationship we would expect in business units across companies we have studied thus far. We will address the practical meaning of these effect sizes later.
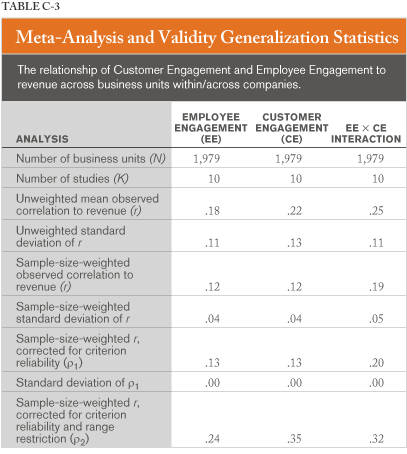 |
Table C-4 provides hierarchical regression analyses (Hypothesis 3). The upper part of Table C-4 provides analysis for the practical situation of business units within companies, and the lower part of the table presents the same analysis for business units across companies. In each case, there is a substantial incremental gain in each step of the hierarchical regression analysis. Customer engagement adds incremental information to employee engagement (in predicting revenue), and the interaction term (EE × CE) adds to the prediction. In the case of business units within companies, the increase in multiple R is equal to two standard error units' gain, thus likely beyond chance. For business units across companies, CE added greater incremental information, and the interaction term contributed unique information in predicting revenue.
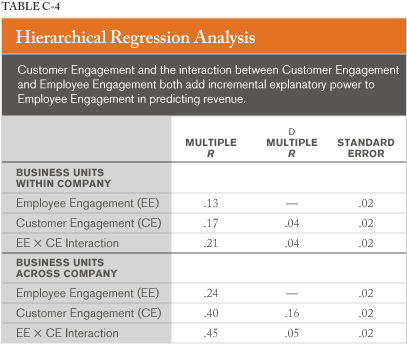 |
Figure C-1 depicts the interaction of employee and customer engagement in relationship to revenue growth. Also, Figure C-1 shows the relationship between employee engagement and financial performance (utility) for different levels of employee engagement, indicating a stronger relationship between employee engagement and financial performance when customer engagement is very low. This means business units low in customer engagement can realize substantial gains by increasing their employee engagement. This is not surprising, given strong evidence of causal direction from employee engagement to customer loyalty and engagement (Harter et al., 2004). Increasing levels of employee engagement can result in numerous benefits, including
increased productivity, greater retention of employees, reduced costs, reduced absenteeism, and reduced theft.
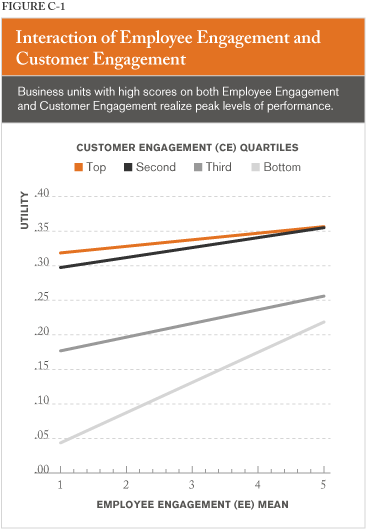 |
Business units high on employee and customer engagement clearly realize peak levels of performance. The slope of the relationship between employee engagement and financial performance is substantial across levels of customer engagement. Next, we turn to a discussion on the practical meaning behind combinations of high and low employee and customer engagement (Hypothesis 4).
Utility Analysis
As mentioned earlier, we have undertaken this research in an effort to identify how improving the engagement level of employees and customers can generate incremental gains in an organization's financial performance. Gallup researchers have accumulated a substantial body of evidence that attests to the practical value of the independent effects of EE and CE. We will not recount this here. The focus of our discussion will instead be the practical meaning of the additional utility gained by improving performance on EE and CE. To do this, we must depart somewhat from the above discussion of "interaction" and instead focus on the analogous construct we refer to as the HumanSigma statistic.
The HumanSigma statistic is the product of a design process, which was to encapsulate the measurement of business unit-level EE and CE performance into a single number that is related to business performance in a meaningful way. One way of thinking about this phenomenon is to look at the bivariate distribution of employee engagement and customer engagement. Splitting business units into two groups on each variable -- at the median of each -- produces four distinct groups:
1. Low Q12, Low CE11
2. High Q12, Low CE11
3. High CE11, Low Q12
4. High Q12, High CE11 ("Optimized")
Analytically, it is useful to take this categorization one step further to represent the full range of values for each separate variable. Combining two intercorrelated measures (CE11 and Q12) into a single composite variable presents the opportunity to have a general "management" variable that represents the net HumanSigma performance of a given business unit. We modeled multiple families of functions against the data available for this study to produce a HumanSigma function that best fits these data. The resulting HumanSigma function is a proprietary nonlinear function of EE and CE performance relative to Gallup's entire database of EE and CE data. The proprietary nature of this function prevents it from being the focus of the analyses. Although, we can note that the departures from linearity were included (1) to account for observed patterns in existing data, (2) to correctly specify business units with radically different levels of performance on EE and CE, and (3) to make the function more robust with respect to sampling and measurement error.
Regarding sampling and measurement error, we decided that HumanSigma would have significantly more practical value if managers could use it without having to maintain constant vigilance with respect to the amount of sampling and measurement error in a given business unit's data, which will vary from study to study. Consequently, HumanSigma data are generally discussed in terms of broad levels of performance, referred to as "HumanSigma levels." These levels are simply standard-deviation groups on the HumanSigma function; with six standard deviations of range in the observed data, there are thus six HumanSigma levels denoted HS1, HS2, and so forth.
Calculating the HumanSigma levels for the business units in this study, we find substantial practical differences in the financial performance of those business units. Using the revenue-growth data from this study and the standard deviation across business units, we applied utility analysis (Schmidt, Hunter, McKenzie, & Muldrow, 1979; Schmidt & Rauschenberger, 1986) to estimate the gain per business unit in moving across levels of the HS distribution. We conducted these analyses using observed and meta-analytic data. Results were quite similar. Using meta-analytic effect sizes presented in this report, and using HS1 as a reference group, the relative performance of each level is as follows:
|
HumanSigma |
Relative Financial |
|
1 |
1.0 |
|
2 |
1.8 |
|
3 |
2.5 |
|
4 |
3.8 |
|
5 |
4.5 |
|
6 |
5.2 |
In our current database, only a small percentage of business units have reached the HS6 level (approximately 1%). Approximately 30% have reached the level of HS4 or above, which is equivalent to business units that fall at or above the 50 th percentile on EE and CE (High Q12, High CE11 mentioned previously). Clearly, business units with three to five times the revenue growth of their peers are of substantial practical value to their respective organizations and worthy of emulation by their peers.
Using the same methodology in reference to the four groups defined by the database median split of EE and CE, the relative financial performance is as follows:
|
Median Split |
Relative Financial |
|
Low Q12, Low CE11 |
1.0 |
|
High Q12, Low CE11 |
1.7 |
|
High CE11, Low Q12 |
1.7 |
|
High Q12, High CE11 |
3.4 |
Discussion
Research on the validation of Q12 and CE11 includes millions of respondents and tens of thousands of business units. The meta-analyses can be viewed as a cross validation of the HumanSigma concept across 10 organizations and 1,979 business units. Meta-analytic findings indicate positive and generalizable relationships to financial performance of business units. As well, hierarchical regression analyses indicate a meaningful interaction. The nature of this interaction is that the slope of the relationship between employee engagement and financial performance is strongest at the lowest levels of customer engagement, but the highest levels of financial performance occur at extremely high levels of employee and customer engagement. Business units that engage employees and customers achieve substantially more than those who engage only one.
There is a ceiling on the utility that can be obtained by improving one of the two engagement constructs (EE or CE). Although the stronger causal link is from employee engagement to customer engagement, employee engagement does not explain all of customer engagement. Business units with high employee engagement will not always have high levels of customer engagement. For instance, management of a business unit may create high employee engagement -- setting clear expectations, involvement, and enthusiasm -- but the direction of that energy may be focused on something other than the customer (inward focus, for instance). In addition, management of a business unit may create high customer engagement -- through products, location, and brand -- despite the engagement level of its employees. However, the sustainability of customer engagement will be at risk if employees remain disengaged across time.
The findings indicate management that has focused on engaging employees and customers will maximize its financial return in terms of the human aspects it can directly influence (HumanSigma). Differences in effect sizes between companies can be attributed to sampling error and other artifacts; therefore, results generalize across the companies and industries studied. Future research will focus on expanding the number of studies and industries represented. Although a broad representation of business units is included in this meta-analysis, we will seek to increase the sample size within each industry. We will also expand the number of studies that include outcome data trailing the engagement measures and begin to study longitudinal relationships and trends. Finally, we will conduct a comprehensive and ongoing study of the key drivers of HumanSigma change.
References
Applebaum, A. (2001). The constant customer [Electronic version]. Gallup Management Journal, 1(2), 17-24. Retrieved December 10, 2003, from /businessjournal/default.asp?ci=745
Asplund, J. W. (2001). Building an optimized store performance model. Gallup Research Report.
Bangert-Drowns, R. L. (1986). Review of developments in meta-analytic method. Psychological Bulletin, 99(3), 388-399.
Cohen, J., Cohen, P., West, S. G., & Aiken, L. S. (2003). Applied multiple regression/correlation analysis for the behavioral sciences (3rd ed.). Mahwah, NJ: Lawrence Erlbaum Associates.
Fleming, J. H., & Harter, J. K. (2001). Optimize. Gallup Management Journal, 1(4), 14-17.
Harter, J. K., Asplund, J. W., Killham, E. A., & Schmidt, F. L. (2004). Employee engagement and performance: a meta-analytic study of causal direction. Gallup Research Report.
Harter, J. K., Schmidt, F. L., & Hayes, T. L. (2002). Business-unit-level relationship between employee satisfaction, employee engagement, and business outcomes: A meta-analysis . Journal of Applied Psychology, 87(2), 268-279.
Harter, J. K., Schmidt, F. L., & Killham, E. A. (2003, July). Employee engagement, satisfaction, and business-unit-level outcomes: A meta-analysis. Omaha, NE: The Gallup Organization.
Hunter, J. E., & Schmidt, F. L. (1990). Methods of meta-analysis: Correcting error and bias in research findings. Newbury Park, CA: Sage.
Hunter, J. E., & Schmidt, F. L. (2004). Methods of meta-analysis: Correcting error and bias in research findings (2nd ed.). Thousand Oaks, CA: Sage.
Hunter, J. E., Schmidt, F. L., & Le, H. (2002). Implications of Direct and Indirect Range Restriction for Meta-Analysis Methods and Findings. Technical Paper. Michigan State University.
Lipsey, M. W., & Wilson, D. B. (1993). The efficacy of psychological, educational, and behavioral treatment. American Psychologist, 48(12), 1181-1209.
Schmidt, F. L. (1992). What do data really mean? Research findings, meta-analysis, and cumulative knowledge in psychology. American Psychologist, 47, 1173-1181.
Schmidt, F. L., & Hunter, J. E. (1996). Measurement error in psychological research: Lessons from 26 research scenarios. Psychological Methods, 1, 199-223.
Schmidt, F. L., Hunter, J. E., McKenzie, R. C., & Muldrow, T. W. (1979). Impact of valid selection procedures on work-force productivity. Journal of Applied Psychology, 64(6), 609-626.
Schmidt, F. L., Hunter, J. E., Pearlman, K., & Rothstein-Hirsh, H. (1985). Forty questions about validity generalization and meta-analysis. Personnel Psychology, 38, 697-798.
Schmidt, F. L., & Rauschenberger, J. (1986, April). Utility analysis for practitioners. Paper presented at the First Annual Conference of The Society for Industrial and Organizational Psychology, Chicago.
Schneider, B. (1991). Service quality and profits: Can you have your cake and eat it too? Human Resource Planning, 14(2), 151-157.


