skip to main content
SGOW > Top Card > 2026 Release > 2026-04 [UPDATE]

State of the Global Workplace 2026

The State of the Global Workplace report features annual findings from the world's largest ongoing study of the employee experience. The 2026 edition finds that global employee engagement fell to 20% in 2025, its lowest level since 2020, costing the world economy an estimated $10 trillion in lost productivity.

Download the full report to explore what’s driving the decline and to review global, regional and country-level trends on engagement, wellbeing, daily emotions, the global job climate and other key workplace statistics across 140+ countries and territories.

About This Research: The findings on this page are from Gallup’s State of the Global Workplace: 2026 Report, an annual study primarily conducted using the Gallup World Poll. The total number of global respondents included in the full trend of data for this report (2009 through 2025) is 5,754,327 (2,616,488 employed respondents); for the 2025 data, the total is 263,810 (141,444 employed) respondents, obtained from January to December 2025.

See full methodology

Cite as: Gallup. (2026). State of the global workplace: 2026 report. Gallup, Inc.

Key Findings

What Is the State of the Global Workplace in 2026?

In 2025, global employee engagement declined for a second year to its lowest level since 2020.

Bar chart showing global employee engagement rising steadily from 12% in 2009 to a peak of 23% in 2022-2023, then declining to 20% in 2025 after two consecutive yearly drops.

Lower engagement among managers accounts for most of the recent downturn in employee engagement.

Bar chart showing global employee engagement by role, with manager engagement declining from 31% in 2022 to 22% in 2025, while non-managers dip slightly from 20% to 19%, narrowing the gap between roles.

Global employee perceptions of the job market improved in 2025, though still below their 2019 peak.

Bar chart showing global perceptions of it being a good time to find a job in local job markets rose from 29% in 2009 to 55% in 2019, then stabilized around 52% in 2025 after a dip to 44% in 2020.

In 2025, global employee wellbeing improved for the first time in three years.

The Employee Engagement Slump Continues

20%

According to Gallup research, the world’s employee engagement has dropped to 20% from its peak in 2022 of 23%, with a margin of error of less than ±0.1 pct. pt.

placeholder

Despite the recent downturn, employee engagement is eight percentage points higher than it was in Gallup’s first measurement in 2009 and five points higher than it was a decade ago. Each percentage point accounts for approximately 21 million employees working for organizations. For millions of workers, the workplace has improved.

That said, recent years are a cause for concern. This is the first time global engagement has dropped for two consecutive years. The largest drop was in South Asia (-5 points). No region of the world increased engagement in the past year.

Last year, low engagement cost the world economy approximately $10 trillion in lost productivity, or 9% of GDP.

Employee engagement measures the psychological attachment workers have to their work, their team and their employer. Gallup meta-analyses over the years have consistently shown a strong relationship between employee engagement and business-unit productivity, including profitability and sales.

While engagement occurs at the team level, employees who are not engaged or actively disengaged lead to less profitable organizations, which, in turn, translates into lower economic growth.

Download Full Report

The Shrinking Perk of Being a Manager

22%

Since 2022, Gallup finds manager engagement has dropped by nine points.

placeholder

Individual contributor engagement also declined but has had a slight rebound. According to the 2026 State of the Global Workplace report, the largest year-over-year drop in manager engagement occurred between 2024 and 2025, when it declined by five points from 27% to 22%. In short, managers used to enjoy an “engagement premium” at work, but they are increasingly only as engaged as those they lead.

South Asia’s decline in manager engagement suggests organizational flattening may be a factor.

In 2025, South Asia (primarily India) experienced an eight-point decline in manager engagement, the largest decline of any region. At the same time, the percentage of managers in South Asia also declined, suggesting that employers are cutting management roles.

Some evidence suggests that in 2025, India’s IT sector saw a substantial slowdown in hiring, along with cuts to mid-level and senior roles, possibly driven in part by AI adoption. With fewer managers in place, team sizes may grow. A recent Gallup study of U.S. managers and team size found that manager engagement declines with larger spans of control, though manager talent and training can offset this effect.

Declining manager engagement is by no means inevitable.

Organizations of all sizes can achieve high levels of manager engagement.

In 2025, Gallup found that within best-practice organizations, 79% of managers were engaged at work — nearly quadruple the global average.

Line chart showing manager engagement by group from 2022-2025, with global manager engagement declining to 22% and U.S. at 36% in 2025, while best-practice organizations remain much higher at 79%, nearly four times the global rate.

These world-class workplaces span all regions and industries, prioritizing employee engagement as part of their long-term business strategy.

Download Full Report

The Future of Jobs

52%

Global employee perceptions of the job market improved in 2025, according to Gallup, following a decline the previous year.

placeholder

As the global economy recovered from the pandemic in 2022, so did job market optimism. In 2023, the percentage of employees who said it was a “good time” to find a job almost tied its 2019 record of 55%.

The last two years, however, have seen job market perceptions lower than at the start of the recovery in 2022. The 2026 State of the Global Workplace report finds that in 2025, job market perceptions improved by one percentage point from the previous year to 52%, with a margin of error of ±0.1 percentage point.

The 2025 increase in job market optimism came entirely from non-remote-capable, fully on-site workers (+2 points).

Job market optimism dropped for fully remote workers (-5 points) and remote-capable, fully on-site workers (-14), while optimism remained flat among hybrid workers. The drop in optimism among remote-capable workers could be due to possible declines in remote job opportunities caused by changes in employer policies or the automation of knowledge work.

In 2025, job market optimism fell sharply in the Australia/New Zealand (-12 points) and the United States/Canada (-10) regions.

Post-pandemic Australia/New Zealand has typically had the best job market in the world, based on employee perceptions. Last year, they fell to second place behind Southeast Asia.

The United States/Canada region, however, is now second-to-last in regional job market rankings. Since 2019, this region has fallen 23 points, from 70% to 47%.

U.S. business media reported on a “no hire, no fire” job climate for most of 2025; more recent revisions to official jobs numbers found that the U.S. added 181,000 jobs last year, compared with 1.5 million the year before. Gallup’s U.S. employee job market survey tracks official jobs data closely.

When employees feel they have a choice in their work, they are nearly 50% more likely to say it’s a good time to find a job.

In partnership with PERSOL and the Wellbeing for Planet Earth Foundation, Gallup has found that when employees feel they have a lot of choice in the work they can do, they are more optimistic about the job market. This holds across every region of the world. As technologies like AI reshape the world of work, upskilling will likely be an essential part of employee hope for the future.

Download Full Report

Managing the Emotional Workplace

34%

After a five-year run of consistent improvement in employee wellbeing (2018-2022), global thriving peaked in 2022 and then started to decline, according to Gallup.

placeholder

In 2025, employee thriving increased by one point, from 33% to 34%. Half of the world regions saw a rise in thriving, with Latin America and the Caribbean (+2 points) and Europe (+2) experiencing the largest increases.

Gallup research finds the percentage of employees who report experiencing a lot of stress, anger or sadness the previous day remains above pre-pandemic levels.

Daily negative emotions among workers increased worldwide during the pandemic. Although they have declined from their peaks, negative emotions remain elevated compared to before 2020, suggesting either lasting psychological impacts or a new, more challenging status quo.

Wellbeing increases when employees see their work as intrinsically rewarding and good for others.

New analysis of Gallup data, collected in partnership with the Wellbeing and Planet Earth Foundation and PERSOL, shows that when employees enjoy their work, feel it improves others’ lives and believe they have choices in what they do, they report stronger wellbeing and higher workplace engagement.

Insight

Leaders have higher life evaluations but worse days than those they lead, according to Gallup data.

In psychology, wellbeing can be measured by examining the reflective self or the experiencing self. How people think about their lives does not always match how they experience them day to day.

When comparing leaders, managers, project managers and individual contributors, higher levels of leadership report higher levels of engagement and wellbeing. At the same time, compared with individual contributors, leaders are substantially more likely to report experiencing a lot of stress (+7 points), anger (+12), sadness (+11) and loneliness (+10) the previous day.

Chart comparing engagement, wellbeing and daily emotions by role, showing leaders highest in engagement (26%) and thriving (43%) but also higher in stress (46%), anger (33%), sadness (34%) and loneliness (31%) than others.

Leadership also offers little upside in terms of positive emotions: Leaders are less likely than individual contributors to say they smiled or laughed a lot the previous day and less likely than managers to report experiencing enjoyment. Although leadership can give individuals a greater sense of voice, agency and status, it can also mean greater social distance and the responsibility for making painful choices that affect many people’s lives.

Download Full Report

AI Adoption and the Global Workplace

Editor’s Note:
  • The following section is compiled from analysis included throughout the State of the Global Workplace: 2026 Report. It is based on U.S. surveys, not Gallup World Poll data.

AI improves personal worker productivity, but macro-level benefits remain elusive.

Among U.S. workers in organizations that have implemented AI, 65% say that AI has had a “somewhat” or “extremely” positive impact on their individual productivity (7% say “somewhat” or “extremely” negative). At the same time, only 12% strongly agree that AI has transformed how work gets done in their organization.

Surveys of leaders reinforce the same disconnect between individual productivity gains and organizational outcomes that employees report. A recent NBER survey of executives in the U.S., U.K., Germany and Australia found that while AI use is widespread in corporations, 89% of leaders report no impact of AI on their company’s labor productivity in the past three years. However, they expect AI will boost productivity by 1.4% over the next three years.

One way of thinking about employee engagement is as a measure of readiness for change. AI is a major disruption; organizations with engaged employees tend to navigate disruptions more successfully. In the age of AI, productivity gains will depend in part on how effectively individual workers use these tools. Disengagement will erode those gains, and active disengagement could create serious security risks.

Managers play a critical role in meaningful AI adoption.

Based on Gallup’s Q1 2026 U.S. workforce survey, the top two drivers of frequent AI use within organizations are AI integration with existing systems and manager-led AI adoption.

Slider chart shows that frequent AI use is higher among employees who strongly agree AI integrates with work systems (86% vs. 52%). It is also higher when managers actively support AI use (79% vs. 46%).

Gallup also finds that managers are key employees' perceptions of AI value. Within U.S. organizations that are investing in AI technology, employees who strongly agree that their manager actively supports their team’s use of AI are:

8.7

times as likely to strongly agree that the AI has transformed how work gets done in their organization

7.4

times as likely to strongly agree that AI gives them more opportunities to do what they do best every day

Despite these clear benefits, many employees report a lack of active support from their managers. Less than a third of U.S. employees in organizations that have begun implementing AI technologies strongly agree their manager actively supports their team’s use of the technology. A Gallup study in Germany found similarly low support: 21% of employees in organizations that use AI said their manager actively supports their team’s use of AI.

AI could boost global employee engagement by improving management practices at scale.

Effective people management is a skill. But few managers have natural management talent, and many have not received the training they need to successfully coach teams and individuals toward high performance. AI tools have the potential to provide real-time, personalized manager advice grounded in the best management science. Such capabilities could be a game-changer for the world’s workplace.

U.S. data show concerns about AI-related job losses are rising.

In Q1 of 2026, Gallup research found that 18% of U.S. employees said it was “very” or “somewhat” likely their job would be eliminated in the next five years due to technological innovations, such as automation or artificial intelligence. In organizations where AI has been implemented, that figure rises to 23%. In some industries, such as finance (32%), insurance (32%) and technology (31%), it is much higher. A separate Gallup survey in Germany found that 19% of German employees in organizations that use AI said it was very or somewhat likely that their job would be eliminated in five years due to automation or AI.

placeholder

Large U.S. employers are more likely to reduce their workforce after implementing AI; smaller employers are more likely to expand their workforce.

In Q1 of 2026, Gallup asked U.S. employees if their employer was expanding or reducing the size of their workforce. Among employees in organizations where AI has been implemented, those who worked in large organizations (10,000+ employees) were more likely to say their employer was reducing their workforce (33%) than expanding (30%). However, those working in smaller organizations, for example, 5,000-10,000 employees, were more likely to say their employer was expanding (38%) vs. reducing (23%) their workforce.

Organizations that have begun implementing AI are more likely to change the size of their workforce — either by expanding or reducing headcount — than those that have not adopted AI. While AI is reconfiguring organizations, the effects on employment are not uniformly negative.

Engagement reduces the emotional burden of leading others and significantly boosts thriving.

Gallup finds that when managers (including leaders) are engaged, they report experiencing all negative emotions at lower rates than individual contributors. They are also 14 points more likely to be thriving in their overall life than the average leader.

When it comes to the AI revolution, recent Gallup research in the U.S. points to two factors that leaders can focus on to improve AI adoption and support the engagement and wellbeing of their workforces: taking steps to thoughtfully integrate AI into current systems and processes, and helping their managers to actively support their team’s use of AI.

Download Full Report

Global Workplace Data

The State of the Global Workplace: 2026 Report includes a global summary of seven indicators of organizational resilience and performance:

Data Page

Regional and Country-Level Workplace Data

The State of the Global Workplace: 2026 Report includes data and insights for more than 140 countries and territories across 10 regions:

Data Page

How Gallup Measures the State of the Global Workplace

Employee Engagement

Employee engagement reflects the involvement and enthusiasm of employees in their work and workplace. Employees can become engaged when their basic needs are met, and they have a chance to contribute, a sense of belonging, and opportunities to learn and grow.

Gallup categorizes employees as engaged, not engaged or actively disengaged.

  • Engaged employees are thriving at work. They are highly involved in and enthusiastic about their work and workplace. They are psychological “owners,” drive performance and innovation, and move the organization forward.
  • Not engaged employees are quietly quitting. They are psychologically unattached to their work and company. Because their engagement needs are not being fully met, they are putting time but not energy or passion into their work.
  • Actively disengaged employees are loudly quitting. They aren’t just unhappy at work. They are resentful that their needs are not being met and are acting out their unhappiness. Every day, these workers potentially undermine what their engaged coworkers accomplish.

How Gallup Measures Employee Engagement

To determine the percentage of engaged, not engaged and actively disengaged employees, Gallup uses a proprietary formula founded on extensive research about how the engagement elements, as measured by the Gallup Q12®, relate to various workplace outcomes. For this reason, employee engagement is a much higher bar than merely satisfaction or metrics that combine “strongly agree” and “agree” responses into a “percent favorable” engagement index.

The current standard is to ask each employee to rate the Q12 statements using six response options, from 5 = strongly agree to 1 = strongly disagree, and the sixth response option — don’t know/does not apply — is unscored. Gallup’s proprietary formula does not require perfect agreement with all Q12 elements for employees to be classified as engaged.

Gallup Q12 Items:

Global Indicator

How Gallup Measures Wellbeing

Gallup’s Life Evaluation Index, which is included as part of the standard set of core questions on the Gallup World Poll, measures respondents’ perceptions of where they stand now and in the future.

Building on the Cantril Self-Anchoring Striving Scale, Gallup measures life satisfaction by quantifying the difference between the best possible life and the worst possible life using a simple two-part question. Gallup asks respondents to place the status of their current and future lives on a “ladder” scale with steps numbered from zero to 10, where zero indicates the worst possible life and 10 the best possible life.

Two-Part Life Evaluation Question

Please imagine a ladder with steps numbered from zero at the bottom to 10 at the top. Suppose we say that the top of the ladder represents the best possible life for you, and the bottom of the ladder represents the worst possible life for you.

On which step of the ladder would you say you personally feel you stand at this time? (0-10)

Just your best guess, on which step do you think you will stand in the future, say about five years from now? (0-10)

How Gallup Defines Thriving, Struggling and Suffering

Gallup classifies respondents into one of three categories of wellbeing — thriving, struggling or suffering — and determines the percentage of respondents in each category.

Individuals who rate their current life at a “7” or higher AND their future life at an “8” or higher are “thriving.” Individuals are “suffering” if they rate their current AND future lives at “4” or below. All other individuals are “struggling.”

Life Evaluations | Present Life: Suffering <=4; Struggling 5-6; Thriving / / / / / / / />=7. Future Life: Suffering <=4; Struggling 5-7; Thriving >=8. Based on the Cantril Self-Anchoring Striving Scale

  • Thriving:

    These respondents have positive views of their present life situation (7 or higher rating on best life present) and have positive views of the next five years (8 or higher rating on best life future). They report significantly fewer health problems and less worry, stress, sadness, loneliness, depression and anger. They report more hope, happiness, energy, interest and respect.

  • Struggling

    These respondents struggle in their present life situation and have uncertain or negative views about their future. They report more daily stress and worry about money than thriving respondents do.

  • Suffering:

    These respondents report that their lives are miserable (4 and below rating on best life present) and have negative views of the next five years (4 and below on best life future). They are more likely to report that they lack the basics of food and shelter and more likely to have physical pain and a lot of stress, worry, sadness and anger. They have less access to health insurance and care and more than double the disease burden compared with thriving respondents.

How Gallup Measures Employee Daily Negative Emotions

Gallup annually surveys around the world to determine people’s day-to-day experiences of emotions by asking if they experienced certain feelings during a lot of the previous day. This report focuses on the emotional experiences of employed adults.

Insight

More on Gallup Job Market Trends

As leaders seek to attract and retain talent, understanding more about employee perceptions of the job climate and why employees choose to join or leave an organization is critical. Employers can evaluate how these topics relate to their own organizational culture to create strategies for attracting top talent and keeping their star employees from being wooed away.

Indicator

Age, Gender, Management Level and Work Location

Global and regional data are cut by age, gender and management level to provide additional insights into the reported data. Global data are also cut by work location, which is only provided for those employees working full time (30 hours or more per week).

How Gallup Calculates the Cost of Not Engaged and Actively Disengaged Employees

Gallup estimates the annual cost of “not engaged” and “actively disengaged” employees in a three-step process.

First, Gallup applies a proprietary formula to the Q12 survey results to calculate the percentage of engaged, not engaged and actively disengaged employees. Assigning employees into these three categories is based on historical data from Gallup’s global employee database — guided by the relationship between a composite of the Q12 engagement elements and performance outcomes.

Gallup and industry experts in academia have published numerous technical studies, including many iterations of meta-analysis, substantiating the relationship between employee engagement and a variety of performance outcomes (Judge et al., 2001; Harter et al., 2002; Harrison et al., 2006; Whitman et al., 2010; Harter et al., 2010; Edmons, 2012; Mackay et al., 2017; Harter et al., 2020a-2020b). These published meta-analytic estimates are combined to estimate the true score correlation of employee engagement and productivity.

Next, widely used published statistical guides (standard utility analysis methods) are used to estimate economic value (Hunter & Schmidt, 1983; Casio, 1996).

Standard utility analysis estimates include three general inputs:

  1. the predictive relationship between employee engagement and productivity

  2. the standard deviation of the economic value of productivity

  3. the standard score increase in the independent variable (in this case, the standard score increase in employee engagement if not engaged and actively disengaged workers were to become engaged)

The standard deviation of the percent increase in output is conservatively estimated (the standard deviation as a percentage of mean output across moderate job skill levels — less skilled to semi-skilled).

Each country’s Gross Domestic Product (GDP) is divided by the total number of workers who work for an organization to yield an estimated per person worth of goods or services per worker.

Applying standard utility analysis methods, Gallup researchers calculate the percentage increase in output per worker attributable to not engaged or actively disengaged workers becoming engaged (Hunter & Schmidt, 1996). The percent increase in output is a function of the relationship between engagement and productivity and the assumed increase in standard score units in engagement.

This percentage increase in output per worker, applied against the average per person GDP output figure, results in a per person gain which, multiplied by the number of workers, results in the overall estimate. These estimates are calculated for each country where data are available and then summed across countries.

Multiple methods of estimating the economic value of lost productivity have resulted in similar figures in the past two decades. These cost estimates do not add together the economic value of separate worker outcomes that are related to the engagement of workers, including safety, turnover, theft and healthcare costs.

Individual outcomes such as these have overlapping cost impacts — some are included in GDP and some, such as opportunity costs, are not. Therefore, the cost estimates should be considered conservative.

Download Full Report

The primary data in this report come from the Gallup World Poll, through which Gallup has conducted surveys of the world’s adult population, using randomly selected samples, since 2005. The survey is typically administered annually face to face or by telephone, covering more than 160 countries and areas since its inception.

In addition to the World Poll data, Gallup collected extensive random samples of working populations in the United States (via web survey); these samples were added to the dataset for this report. 2024 data for China were collected using an opt-in web self-administered mode (computer-aided web interviewing, or CAWI) over two administrations of the survey during the course of the year.

The total number of global respondents included in the full trend of data for this report (2009 through 2025) is 5,754,327 (2,616,488 employed respondents); for the 2025 data, the total is 263,810 (141,444 employed) respondents. 2025 data included in this report were obtained from January to December 2025.

The target population of the World Poll is the entire civilian, noninstitutionalized, aged 15 and-older population. Gallup’s data in this report reflect the responses of adults aged 15 and older who were employed for any number of hours by an employer.

With rare exceptions, all samples are probability based and nationally representative. Gallup uses data weighting to:

  • minimize bias in survey-based estimates
  • ensure samples are nationally representative for each country or area
  • correct for unequal selection probability, nonresponse and overlap of landline and mobile phone users when using mobile phone and landline frames

Gallup also weights its final samples to match the national demographics of each country or area.

For global and regional percentage-point change, the data are rounded before calculating the difference between time periods to stay consistent with the trendlines shown by item. In 2025, Gallup began to report regional data based on data aggregated from three years of polling. Regional data reported prior to 2025 were based on that region's annual average.

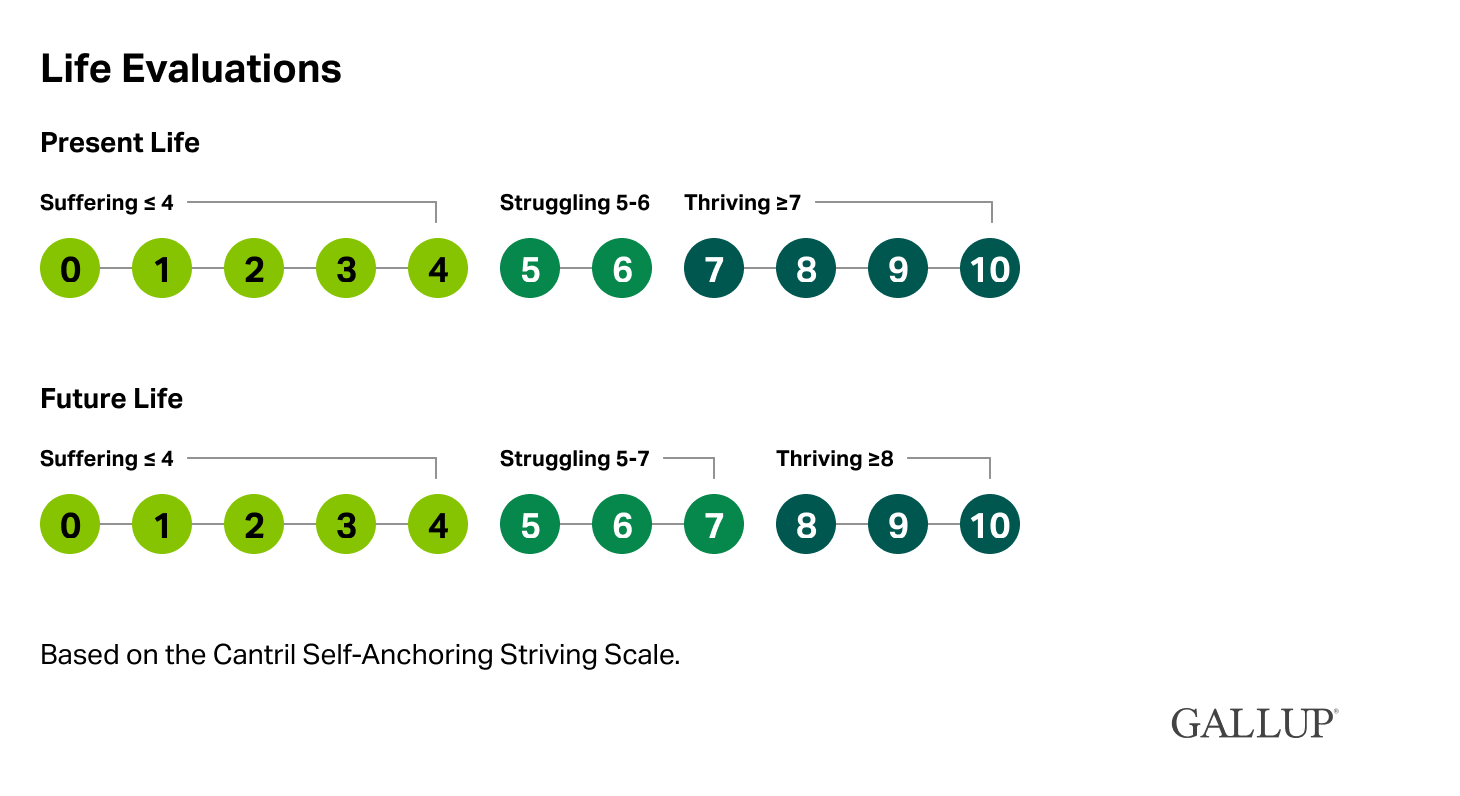
Country-specific findings in “Appendix 1: Country/Territory by Region Data” are based on data aggregated from three years of polling. Percentage-point changes for countries and areas indicate the differences in percentage points when comparing the country’s average from 2022, 2023 and 2024 with the average from 2023, 2024 and 2025, with several countries’ data obtained in the early months of the following year and reported as part of the current year’s results. When shown, change data may sum to +/-1 pct. pt. due to rounding. Engaged, not engaged and actively disengaged percentages, as well as thriving, struggling and suffering percentages, may not sum to 100% due to rounding.

Global and regional engagement data were not collected in 2010 or 2011, therefore the 2011 datapoint counts only 2009; the 2012 datapoint counts only 2012; the 2013 datapoint counts 2012 and 2013; and the 2014 datapoint counts all three years: 2012, 2013 and 2014. Engagement data were also not collected in 2017.

Gallup typically surveys 1,000 individuals in each country or area using a standard set of core questions translated into the respective country’s major languages. In some countries, Gallup collects oversamples in major cities or areas of special interest. In a small number of countries, the sample size is fewer than 1,000 individuals. In this report, Gallup does not provide data (three-year aggregate) for any region or country with an aggregate n size of fewer than 300. However, results from countries or areas with a sample of any size during the 2025 World Poll collection year are included in regional and global results.

For results based on the total sample of employed adults globally, the margin of sampling error ranged from ±0.05 percentage points to ±0.08 percentage points at the 95% confidence level. For results based on the total sample of employed adults in each region, the margin of sampling error ranged from ±0.26 percentage points to ±2.37 percentage points at the 95% confidence level. For results based on the total sample of employed adults in each country, the margin of sampling error ranged from ±0.25 percentage points to ±7.07 percentage points at the 95% confidence level. All reported margins of sampling error include computed design effects for weighting.

Gallup is entirely responsible for the management, design and control of the Gallup World Poll. For more than 80 years, Gallup has been committed to the principle that accurately collecting and disseminating the opinions and aspirations of people around the globe is vital to understanding our world. Gallup’s mission is to provide information in an objective, reliable and scientifically grounded manner.

Gallup is not associated with any political orientation, party or advocacy group and does not accept partisan entities as clients. Any individual, institution or governmental agency may access the Gallup World Poll regardless of nationality. The identities of clients and all surveyed respondents remain confidential.

The World Poll monitors the issues that matter most to societies worldwide, such as personal safety, food and shelter, employment, wellbeing and confidence in national institutions. In addition to conducting our core polls, organizations worldwide turn to Gallup to conduct custom surveys using our rigorous research standards and scientifically proven methodologies to help them solve their most pressing problems.

Related Content

Other Work

Additional Work Insights

Global Employee Engagement Continues Decline

Global Employee Engagement Continues Decline

New data reveal meaningful changes in the employee experience, as global employee engagement declines for a second year, manager engagement drops and job market perceptions shift worldwide.

Get This Report Via Email

We will send you a copy of this full report and updates about our latest global analytics research and polling.

(*) Required