| Date(s) | 14-day rolling average | 3-day rolling average |
|---|---|---|
| 07/31/2017 | $101 | $96 |
| 07/30/2017 | $101 | $96 |
| 07/29/2017 | $101 | $86 |
| 07/28/2017 | $103 | $104 |
| 07/27/2017 | $106 | $109 |
| 07/26/2017 | $105 | $110 |
| 07/25/2017 | $103 | $99 |
| 07/24/2017 | $106 | $99 |
| 07/23/2017 | $112 | $102 |
| 07/22/2017 | $111 | $100 |
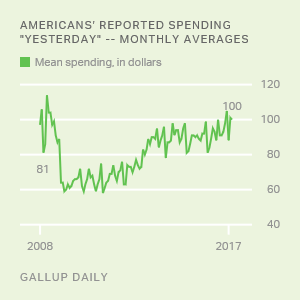
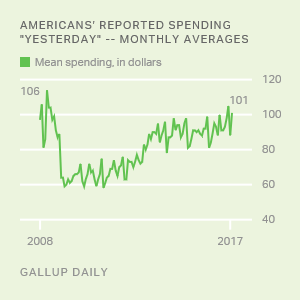
Gallup tracks daily the average dollar amount Americans report spending or charging on a daily basis, not counting the purchase of a home, motor vehicle, or normal household bills. Respondents are asked to reflect on the day prior to being surveyed and results are presented here in both a 3-day and 14-day rolling average. Results are based on telephone interviews with approximately 1,500 national adults; Margin of error is ±3 percentage points.
Note: As of July 31, 2017, Gallup will no longer routinely measure consumer spending.