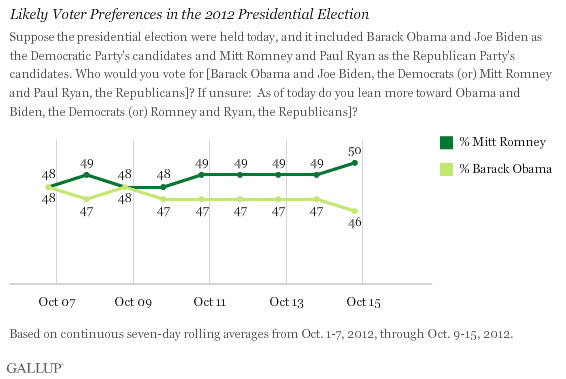
PRINCETON, NJ -- Half of likely voters now prefer Mitt Romney for president and 46% back President Barack Obama in Gallup interviewing through Monday.

While Romney's four-percentage-point advantage is not statistically significant, he has consistently edged ahead of Obama each of the past several days in Gallup's seven-day rolling averages conducted entirely after the Oct. 3 presidential debate. Prior to that debate -- regarded as a decisive Romney win by political experts and Americans who watched it -- Romney averaged less than a one-point lead over Obama among likely voters.
The latest result, from Oct. 9-15, is based on 2,723 likely voters drawn from more than 3,100 registered voters.
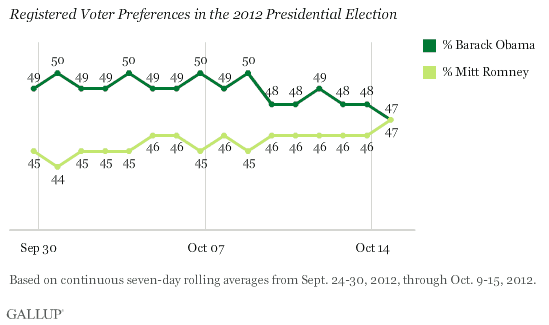
The effect of the Denver debate on voter preferences is also seen in the trend among registered voters. Prior to the debate, in late September/early October, Obama generally led Romney by five or six points among registered voters. Since the debate, the margin has been three points or less.

Since 2008, Obama Down the Most Among Whites, Middle-Aged Voters, and Southerners
Romney's four-point edge over Obama in likely voters' preferences for president contrasts with Obama's seven-point win over McCain in the 2008 election. To gain an understanding of the underlying dynamics of this shift, the following analysis contrasts the Obama versus McCain margins across major subgroups in 2008 with the Obama versus Romney margins in the full week of Gallup interviewing conducted Oct. 9-15. This shows that compared with 2008, Obama's support is down the most among voters in the South, 30- to 49-year-olds, those with four-year college degrees, postgraduates, men, and Protestants. He has also slipped modestly among whites, Easterners, women, and Catholics.
Obama's support is roughly the same now as in 2008 among 18- to 29-year-olds, seniors, nonwhites, and voters in the West and Midwest; however, he has not gained support among any major group compared with 2008.
In order to compare Obama's support today with 2008, the data in the graph below for both 2008 and 2012 are re-percentaged on the basis of support for the Democratic and Republican candidates only, excluding "no opinion" responses and support for minor third-party candidates. The 2008 results reflect an additional adjustment to align Gallup's final likely voter result with the election outcome.

More specifically, here are the key changes in Obama's support by group since 2008:
- Degreed voters backing off Obama: In 2008, Obama led McCain among postgraduate educated voters by a 30-point margin, while he ran roughly even with McCain among those with lower levels of education. Today, Obama's postgraduate advantage has been cut to 14 points and he trails Romney among college graduates (those with four-year degrees only) by 22 points. His support from high school graduates and those with some college is also down slightly, providing no counterbalance to his major losses among the college educated.
- Southern losses: The South gave Obama the least support of any region in 2008, but still split their vote evenly for Obama vs. McCain. Today, Southerners favor Romney by a 22-point margin, the largest shift of any region. Voters in the East are also less supportive, while preferences in the West and Midwest are little changed.
- Young voters stick with him: Young voters were an important part of Obama's 2008 coalition, and in 2012 they continue to support him overwhelmingly, at roughly the same level as four years ago. The difficulty for Obama is that he currently has less support among each older age group, particularly those aged 30 to 49 years.
- White support dwindles: Obama lost the white vote in 2008 by 12 percentage points, but that was more than offset by a 72-point lead among nonwhites. Today, Obama has a more daunting 22-point deficit among whites, while his margin over Romney among nonwhites is essentially unchanged.
- Men move away: In 2008, Gallup found a 14-point swing in gender preferences for president, with women favoring Obama by a 14-point margin and men tied in their preferences for Obama vs. McCain. Today, there is a 20-point gender gap. Women's support for Obama shrank to six percentage points, while men favor Romney by 14 points.
Bottom Line
With three weeks to go in the campaign, Obama appears to be losing momentum, and now trails Romney by four percentage points among likely voters. That contrasts with his seven-point win over McCain in 2008. Given this shift in overall voter preferences, it follows that Obama will have lost support among at least some subgroups of the electorate. Those losses are not proportionate across all subgroups, however. He shed the most support among Southerners, college graduates, postgraduates, 30- to 49-year-olds, men, and Protestants. He also lost a moderate amount of support among whites, Easterners, women, and Catholics -- while not building new support elsewhere.
Gallup's registered voter trends indicate that Obama has lost ground with voters since the start of the month, most likely reflecting his poorly reviewed performance in the first presidential debate. Gallup research indicates that debates are rarely transformative events in presidential elections, but Denver may ultimately be seen as an exception, given the changes, albeit minor, that ensued in what has been a highly competitive election. Obama must now hope to reverse those with a resounding win of his own in at least one or both of the upcoming debates in New York and Florida.
Survey Methods
Results are based on telephone interviews conducted as part of Gallup Daily tracking Oct. 9-15, 2012, with a random sample of 3,187 registered voters, aged 18 and older, living in all 50 U.S. states and the District of Columbia.
For results based on all registered voters, one can say with 95% confidence that the maximum margin of sampling error is ±3 percentage points.
For results based on 2,723 likely voters, one can say with 95% confidence that the maximum margin of sampling error is ±3 percentage points.
Interviews are conducted with respondents on landline telephones and cellular phones, with interviews conducted in Spanish for respondents who are primarily Spanish-speaking. Each sample includes a minimum quota of 400 cell phone respondents and 600 landline respondents per 1,000 national adults, with additional minimum quotas among landline respondents by region. Landline telephone numbers are chosen at random among listed telephone numbers. Cell phones numbers are selected using random digit dial methods. Landline respondents are chosen at random within each household on the basis of which member had the most recent birthday.
Samples are weighted by gender, age, race, Hispanic ethnicity, education, region, adults in the household, and phone status (cell phone-only/landline only/both, cell phone mostly, and having an unlisted landline number). Demographic weighting targets are based on the March 2011 Current Population Survey figures for the aged 18 and older non-institutionalized population living in U.S. telephone households. All reported margins of sampling error include the computed design effects for weighting and sample design.
The questions reported here were asked of a random half-sample of respondents for seven nights on the Gallup Daily tracking survey.
In addition to sampling error, question wording and practical difficulties in conducting surveys can introduce error or bias into the findings of public opinion polls.
For more details on Gallup's polling methodology, visit https://www.gallup.com/.
