PRINCETON, NJ -- Whites and nonwhites have long shown differing political party preferences, with nonwhites widely favoring the Democratic Party and whites typically favoring the Republican Party by at least a small margin. In recent years, however, the margins in favor of the Republican Party among whites have been some of the largest.
The results are based on yearly aggregates of Gallup poll data since 1995, the first full year that Gallup regularly measured Hispanic ethnicity. For this analysis, Gallup defines whites as non-Hispanic whites, and nonwhites as blacks, Hispanics, Asians, and all other races combined.
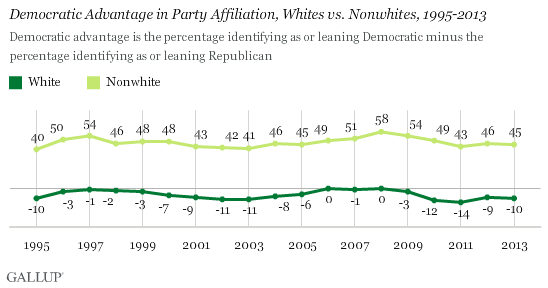
The net Democratic advantage represents the percentage of each racial/ethnic group identifying as Democratic minus the percentage identifying as Republican. Positive scores indicate that a group is more Democratic than Republican; negative scores indicate the reverse. The full trends in party preferences for both racial groups are shown on page 2.
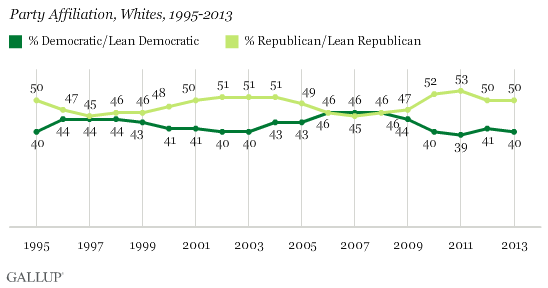
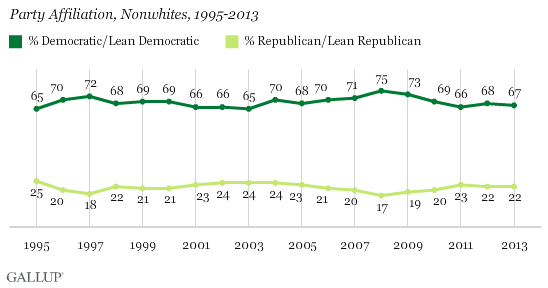
The trend lines in white and nonwhite party preferences often move in the same direction, but with a sizable gap maintained between them. For example, both racial groups drifted in a more Republican direction from 2001-2003, after the 9/11 terrorist attacks. Whites and nonwhites became increasingly Democratic in the last years of the Bush presidency, with whites as likely to favor the Democratic Party as the Republican Party from 2006-2008. Since 2009, whites and nonwhites have trended more Republican.
In recent years, party preferences have been more polarized than was the case in the 1990s and most of the 2000s. For example, in 2010, nonwhites' net party identification and leanings showed a 49-point Democratic advantage, and whites were 12 percentage points more Republican than Democratic. The resulting 61-point racial and ethnic gap in party preferences is the largest Gallup has measured in the last 20 years. Since 2008, the racial gaps in party preferences have been 55 points or higher each year; prior to 2008, the gaps reached as high as 55 points only in 1997 and 2000.
Party Preferences More Polarized Under Obama Than Under Bush or Clinton
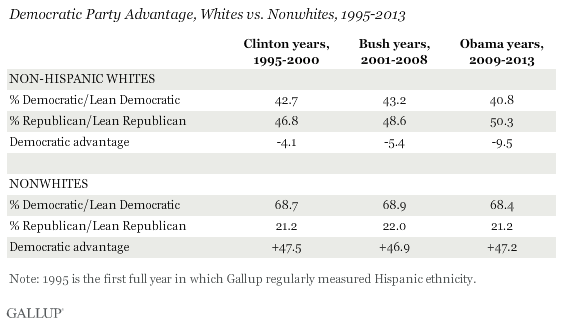
The increasing racial polarization in party preferences is evident when comparing the data by presidential administration. Nonwhites' average party preferences have been quite stable across the last three administrations, consistently showing a roughly 47-point Democratic advantage under Clinton, Bush, and Obama. On average, 69% of nonwhites have identified as Democrats or said they were independents who leaned Democratic, and 21% have identified as Republicans or leaned Republican.
Meanwhile, whites have become increasingly Republican, moving from an average 4.1-point Republican advantage under Clinton to an average 9.5-point advantage under Obama.
This polarization could ease by the time Obama's term finishes, in three years. However, given the already large racial gap in party preferences in his first five years, unless there is a dramatic shift among whites toward the Democratic Party or among nonwhites toward the GOP in the next three years, party preferences will end up more racially polarized in Obama's presidency than in his two predecessors' administrations.
Implications
Over the last two decades, whites have tended to favor the Republican Party and nonwhites have overwhelmingly favored the Democratic Party. During the last few years, those racial and ethnic divisions have grown, mostly because whites have drifted more toward the GOP. Thus, party preferences by race during the Obama years, though similar in nature to the past, have seen some movement that has resulted in slightly greater racial polarization than before.
It is unclear precisely what role Obama's race has played in these changes. However, the shifts do not appear to be an immediate reaction to his becoming president. Whites became slightly more Republican during 2009, the first year of Obama's presidency. However, the biggest movement came during the next year, when Obama signed the healthcare overhaul into law but saw his approval rating sink and his party lose its large majority in the House in that year's midterm elections. Further, whites were about as likely to favor the Republican Party at points during George W. Bush's presidency as they are now.
Whites are somewhat less likely to align with the Republican Party now than they were in 2010 and 2011, but they still show a roughly 10-point advantage in that direction. Although whites remain the majority racial group in the U.S., the Democrats' decisive advantage among racial and ethnic minorities allows them to more than offset the Republicans' advantage among whites, and thus enjoy the advantage, nationally.
With the U.S. becoming increasingly racially and ethnically diverse, the balance of political power may shift toward the Democrats unless Republicans increase their advantage among a shrinking white majority, or cut into Democrats' advantage among nonwhite voters.
Survey Methods
Results are based on yearly aggregated data from multiple day Gallup telephone polls conducted between 1995 and 2013. Each yearly aggregate is based on a minimum of 18,000 interviews with adults age 18 and older.
For results based on the total sample of national adults in any given year, the margin of sampling error is ±1 percentage point at the 95% confidence level.
For results based on the total sample of non-Hispanic whites in any given year, the margin of sampling error is ±1 percentage point at the 95% confidence level.
For results based on the total sample of nonwhites in any given year, the margin of sampling error is a maximum of ±2 percentage points at the 95% confidence level.
In addition to sampling error, question wording and practical difficulties in conducting surveys can introduce error or bias into the findings of public opinion polls.
For more details on Gallup's polling methodology, visit www.gallup.com.