PRINCETON, NJ -- As they have for most of the past two decades, Americans who drink alcohol choose beer over wine and liquor as the type of alcohol they imbibe most often. This year, 41% of U.S. drinkers report they typically drink beer; 31% name wine and 23% name liquor.
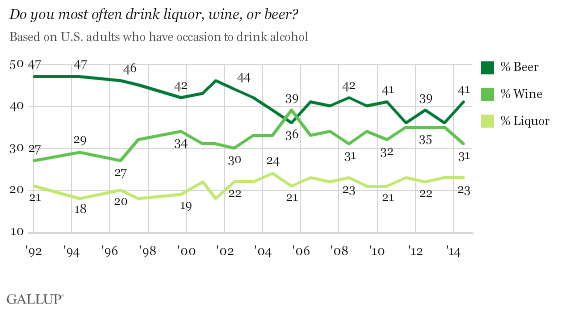
At 41%, Americans' current preference for beer is among the highest Gallup has recorded since beer tumbled to 36% on this measure in 2005 -- although still not as highly favored as it was in the 1990s, when nearly half preferred it.
The 2005 dip for beer occurred at the peak of an apparent increase in American drinkers' preference for wine between 2002 and 2005. Since then, drinkers' tastes have reverted somewhat, with beer back on top. Slightly more drinkers still choose wine today than did so in the early to mid-1990s; however, wine shows no upward momentum.
Consistent with recent years, wine continues to be the top choice for women, at 46%. Among men, wine (17%) trails both beer (57%) and liquor (20%). Wine edges out beer among older adults: 38% of those 55 and older drink wine most often, compared with 32% who most often drink beer. By contrast, the plurality of 18- to 34-year-olds (48%) and those aged 35 to 54 (43%) prefer beer.
The latest results are from Gallup's July 7-10 Consumption Habits survey, and are based on telephone interviews with U.S. national adults, aged 18 and older.
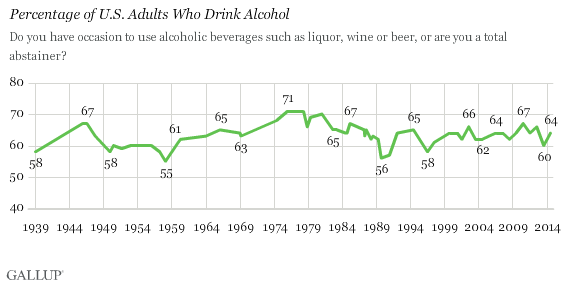
Nearly Two-Thirds of U.S. Adults Drink Alcohol
Sixty-four percent of U.S. adults say they "have occasion to use alcoholic beverages," whereas 36% identify as total abstainers. The percentage of drinkers is about the same -- 65% -- among adults 21 and older, those for whom drinking is legal.
The current percentage of drinkers among the general population is similar to the 63% average across Gallup's long-term trend, which started in 1939. However, in the three-quarters of a century Gallup has tracked this, self-reported drinking has been as low as 55% in 1958, and as high as 71% in the mid- to late 1970s. By contrast, since 1997, the percentage of drinkers has narrowly ranged between 60% and 67%.
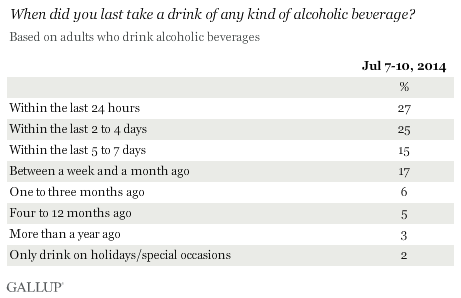
Most Americans who drink alcohol appear to do so fairly regularly, as 67% report having had at least one drink in the past week. Another quarter most recently drank within the last three months, while 10% say it was further back in time. Some of these less-frequent drinkers include people who say they drink only on special occasions.
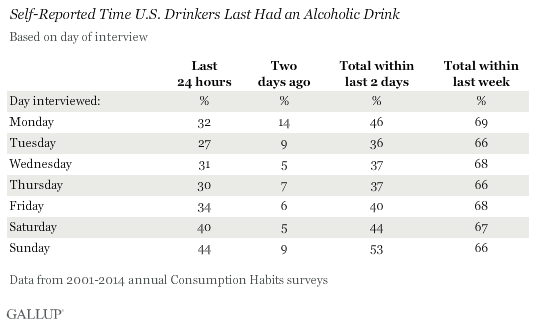
Reported Drinking Rises on Weekends
More Americans are drinking on the weekends than on weekdays. This is evident in an analysis of Gallup's alcohol consumption data from 2001 through 2014, encompassing nearly 10,000 interviews with adult drinkers. Over this period, the percentage of drinkers who report having had alcohol in the past 24 hours varies according to the day of week on which respondents were interviewed.
Adults interviewed on Sundays were the most likely to say they had had an alcoholic drink in the prior 24 hours, at 44%, followed by those interviewed on Saturdays, at 40%. Those interviewed on Tuesdays were the least likely to have had a drink in the past day, at 27%. This was followed by Thursdays (30%) and Wednesdays (31%). Reported drinking was slightly higher on Mondays, at 32%, likely because of more frequent drinking on Sundays.
Reports of most recently having had a drink "two days ago" reinforce the finding that drinking is higher on weekends, while, regardless of the day of interview, roughly two-thirds indicate they had a drink within the previous seven days.
Average Drinks Consumed Weekly Holds Steady at 4.1
Gallup measures the amount Americans drink by asking those who ever drink to report how many drinks they had in the past seven days. This year, the average consumed by drinkers in the past week is 4.1, similar to the average in recent years. This includes 35% who had no drinks in the past week, and 50% who had between one and seven drinks. The average is pushed higher by the 9% who had between eight and 19 drinks, and the 5% who had 20 or more.
Reported alcohol consumption is a bit lower today than it was from 2002 to 2010, when the average approached five drinks, but it is higher than in the late 1990s, when drinkers consumed closer to 3.5 drinks per week, on average.

Bottom Line
Drinking is the norm for about four in 10 Americans. That includes 32% who say they had between one and seven drinks in the past week and another 9% who consumed eight or more drinks. Another 22% appear to drink less routinely, while slightly more than one-third don't drink at all.
On average, U.S. drinkers consume about four drinks per week. And to the extent they drink, it is more likely to be on the weekend than any day during the week.
No single type of alcohol dominates American culture, but beer edges out wine as the preferred drink, although by a smaller margin than it did a decade or so ago.
Survey Methods
Results for this Gallup poll are based on telephone interviews conducted July 7-10, 2014, with a random sample of 1,013 adults, aged 18 and older, living in all 50 U.S. states and the District of Columbia.
For results based on the total sample of national adults, the margin of sampling error is ±4 percentage points at the 95% confidence level.
For results based on the total sample of 645 adults who drink alcoholic beverages, the margin of sampling error is ±4 percentage points at the 95% confidence level.
Results for drinking by day of week are based on combined data from Gallup's annual consumption surveys, from 2001 through 2014, including interviews with 9,847 adults who say they ever have occasion to drink alcohol. The results for each day of the week are based on a minimum of 858 interviews and a maximum of 2,930 interviews. For more information about the margin of error around these estimates, please contact Gallup. Interviews are conducted with respondents on landline telephones and cellular phones, with interviews conducted in Spanish for respondents who are primarily Spanish-speaking. Each sample of national adults includes a minimum quota of 50% cellphone respondents and 50% landline respondents, with additional minimum quotas by time zone within region. Landline and cellular telephone numbers are selected using random-digit-dial methods. Landline respondents are chosen at random within each household on the basis of which member had the most recent birthday.
Samples are weighted to correct for unequal selection probability, nonresponse, and double coverage of landline and cell users in the two sampling frames. They are also weighted to match the national demographics of gender, age, race, Hispanic ethnicity, education, region, population density, and phone status (cellphone only/landline only/both, and cellphone mostly). Demographic weighting targets are based on the most recent Current Population Survey figures for the aged 18 and older U.S. population. Phone status targets are based on the most recent National Health Interview Survey. Population density targets are based on the most recent U.S. census. All reported margins of sampling error include the computed design effects for weighting.
In addition to sampling error, question wording and practical difficulties in conducting surveys can introduce error or bias into the findings of public opinion polls.
View survey methodology, complete question responses, and trends.
For more details on Gallup's polling methodology, visit www.gallup.com.