A recent Gallup analysis shows that almost all Americans either have children, plan on having children, or if they are older and childless, wish that they had had children when they were younger. Additionally, most Americans think that the ideal size for a family these days would be somewhere between two and three children.
Ubiquity of Children
The prevalence of children in American households is nearly identical today to what Gallup found in 1990. A little more than 7 in 10 Americans aged 18 and older have had children at some point in their lives. One quarter of adults with at least one child tell Gallup that they have two children, making two the most common number of children for families to have. Fifteen percent have had either one child or three children, while 16% have had four or more children. This distribution of children is very similar to what a Gallup Poll measured in April 1990:
|
How many children, if any, have you had? |
|||||||
|
|
|
|
|
|
Five or more |
No opinion |
|
|
2003 Jul 18-20 |
28% |
15 |
25 |
15 |
10 |
6 |
1 |
|
1990 Apr 19-22 |
26% |
14 |
26 |
16 |
8 |
10 |
-- |
About two-thirds of those American adults who don't have children are between 18 and 40 years of age, but the vast majority -- 86% -- of these say they would like to have children someday:
|
Do you want to have children someday, or not? |
|||
|
(BASED ON –176—ADULTS AGED 18-40 WHO DO NOT HAVE CHILDREN) |
|||
|
Yes |
No |
No opinion |
|
|
2003 Jul 18-20 |
86% |
11 |
3 |
What about the third of Americans who don't have children and are over 40? The majority of these people say that, if they had it to do over again, they would have at least one child:
|
If you had to do it over again, how many
children would you have, |
|||||||
|
(BASED ON –90—ADULTS AGED 41 AND OLDER WHO DO NOT HAVE CHILDREN) |
|||||||
|
|
|
|
|
|
Five or more |
No opinion |
|
|
2003 Jul 18-20 |
24% |
10 |
46 |
13 |
1 |
1 |
5 |
|
1990 Apr 19-22 |
30% |
1 |
35 |
9 |
9 |
8 |
8 |
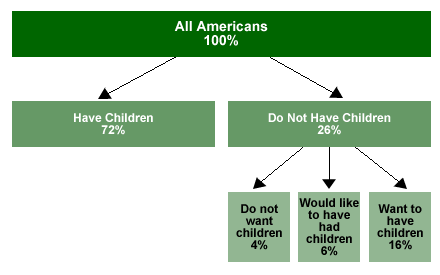
Putting these findings together illustrates the near universal desire for having children:

As can be seen, just about 4% of the adult population in America is satisfied not to have children, either saying they don't plan on having them or (if older and childless) that they are glad that they never had any. (One dimension not measured in the poll is the percentage of Americans who do have children, but would opt not to if they could do it over again.)
Evolutionary biologists argue that the driving force in the development of any species is the procreative imperative. These data certainly seem to confirm that hypothesis. Most adults living in the United States have either managed to produce offspring, or are planning to do so in the future. For those Americans who are older and for some reason did not have children, it is clear that the evolutionary function appears to continue to operate: most wish that they had.
Ideal Number of Children: Trend
There has been a great deal of concern in some European countries that adults are no longer as interested in having large families, and that the net result has been to slow down the internal reproduction rate in these countries to the point at which they may experience native population losses.
There is, however, no evidence from the United States that Americans have significantly downsized their perceptions of what constitutes an ideal family size over the last 30 years.
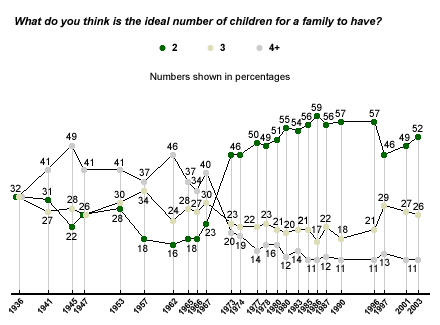
A July Gallup Poll shows that the average ideal family size for Americans is 2.5 children. That's based on a question Gallup has been asking since 1936: "What do you think is the ideal number of children for a family to have?"
The 2.5 average is exactly the same as it was 23 years ago and just slightly lower than the ideal family size of 2.8 Gallup measured in 1973.
But there was clearly a desire for more children in the years between the Depression and the late 1960s. The calculated average ideal family size was well above three children in all of Gallup's polls during that time, reaching its highest points in 1936 and 1957 at 3.6.
The big change on this measure came between Gallup's 1967 survey and the next time it was measured, in 1973. The 1967 data showed that the average American believed the ideal number of children for a family should be 3.4. This decreased to 2.8 by 1973.

Gallup trends show that a great deal of social attitudes changed in the five-year period between the late 1960s and early 1970s, including attitudes toward such things as premarital sex and trust in government. Apparently a decrease in the desire for large numbers of children was also part of this major reorganization of social attitudes.
There has been a slight increase in the perceived desirability of three children since 1997, but the overall average estimate has remained much the same.
Ideal Number of Children by Subgroup
Just who is most interested in having large numbers of children? The Gallup analysis looked at those subgroups of the population most likely to perceive that the ideal family size is three or more children, based on the July Gallup Poll. (This survey did not ask the respondents for their religious affiliation, so we are unable to examine differences in ideal family size between Catholics' and Protestants' religious variables.)
The average across all adults is 37%.
|
Ideal Number of Children July 18-20, 2003 |
|
|
3 or more children |
|
|
% |
|
|
Nonwhites |
48 |
|
Weekly churchgoers |
47 |
|
65 years and older |
44 |
|
Have children under age 18 |
44 |
|
$30,000 to $49,999 a year |
43 |
|
18- to 29-year-olds |
42 |
|
Conservative |
42 |
|
Democrats |
42 |
|
South |
40 |
|
Midwest |
39 |
|
Less than $20,000 a year |
39 |
|
Nearly weekly/monthly churchgoers |
39 |
|
Postgraduate education |
38 |
|
Have children |
38 |
|
Total |
37 |
|
Women |
37 |
|
Some college education |
37 |
|
High school education or less |
37 |
|
Men, aged 18 to 49 |
37 |
|
Women, aged 50 and older |
37 |
|
Not married |
37 |
|
Women, aged 18 to 49 |
36 |
|
Men |
35 |
|
$50,000 to $74,999 a year |
35 |
|
30- to 49-year-olds |
34 |
|
Men, aged 50 and older |
34 |
|
Republicans |
34 |
|
Married |
34 |
|
East |
33 |
|
Whites |
32 |
|
Moderate |
32 |
|
Liberal |
32 |
|
Independents |
32 |
|
West |
31 |
|
College graduate |
31 |
|
$75,000 a year or more |
31 |
|
50- to 64-year-olds |
29 |
|
Do not have children |
29 |
|
$20,000 to $29,999 a year |
28 |
|
Seldom churchgoers |
27 |
Those subgroups that are six points or higher above that average (43% or higher) include:
- Nonwhites
- Weekly churchgoers
- Those aged 65 and older
- Those who currently have children under 18
- Those making $30,000 to $49,000 a year in family income
Those subgroups that are six points or lower below that average (31% or lower) include:
- Those living in the West
- College graduates
- Those making $75,000 or more in family income
- Americans aged 50 to 64
- Those who currently do not have children
- Those making $20,000 to $29,000 in family income
- Those who seldom go to church
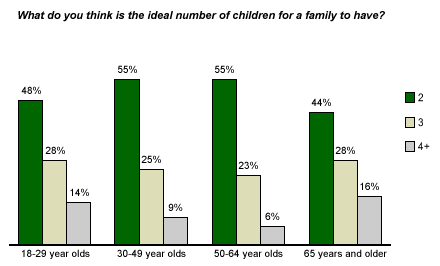
There is an interesting pattern by age:

The greatest interest in larger numbers of children occurs among those who are aged 65 and older, not surprising given the trend data reviewed above that show that the general attitude in America before the 1970s was a desire for larger families.
Those Americans in the middle age ranges between 30 and 64 are slightly less likely than those younger and older to indicate larger ideal family sizes. Perhaps the realities of raising children, from financial requirements to the time necessary for child-rearing, help contribute to the drop in the number of people in their 30s and 40s who are interested in larger family sizes.
*Results are based on telephone interviews with 1,003 national adults, aged 18 and older, conducted July 18-20, 2003. For results based on the total sample of national adults, one can say with 95% confidence that the margin of sampling error is ±3 percentage points.
For results based on the sample of 176 adults age 18-40 years who do not have children, the maximum margin of sampling error is ±8 percentage points.
For results based on the sample of 90 adults age 41 and older who do not have children, the maximum margin of sampling error is ±11 percentage points.
In addition to sampling error, question wording and practical difficulties in conducting surveys can introduce error or bias into the findings of public opinion polls.