GALLUP NEWS SERVICE
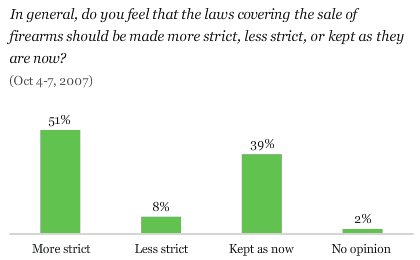
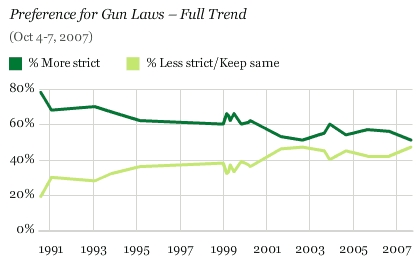
PRINCETON, NJ -- The gap between the proportion of Americans advocating stricter gun laws and those in favor of maintaining or weakening existing gun laws -- once nearly 60 points in favor of stronger gun control, and registering 14 points a year ago -- is just four points in Gallup's latest poll. According to the Oct. 4-7, 2007, survey, 51% of Americans believe the laws governing the sale of firearms should be more strict. When combined, the percentages saying the laws should either be kept as they are or made less strict is nearly as high (47%).
In numerous measures of this question between 1990 and 2000, no fewer than 60% of Americans favored the "more strict" option, producing a consistently sizeable gap in favor of the more gun-control oriented position.
There was a significant change in October 2001, one month after the 9/11 terrorist attacks. In that survey, the percentage favoring stricter gun laws fell to 53%, narrowing the gap between this view and those favoring the status quo or weaker laws to only 7 points. This gap remained low in 2002, but then subsequently swelled to double digits for most of the period from 2003 to 2006, only shrinking again to this year's 4 points. Given that the country is entering a national election year, a time when gun control issues would normally be expected to be debated, the latest results are a notable reversal.
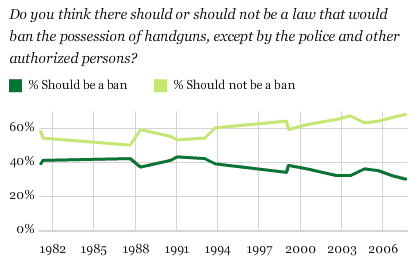
Various localities around the country, including Washington, D.C., have passed bans on the possession of handguns by ordinary citizens. However, since 1975, Gallup has found a solid majority of Americans disagreeing with laws. And, public opposition has expanded in recent years. The current 68% saying handguns should not be banned is similar to the 66% last year, but significantly higher than the 50% in 1987.
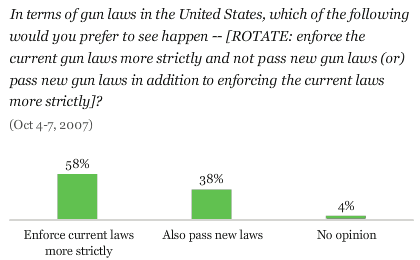
Americans' opposition to aggressive gun control is further evident in a question eliciting their attitude about the need to pass new gun laws. Gallup asked respondents whether they would prefer to see the United States enforce current gun laws more strictly and not pass new gun laws, or pass new gun laws in addition to enforcing current laws more strictly. A solid majority of Americans (58%) opt for focusing exclusively on better enforcement of existing laws -- a position similar to that advocated by the National Rifle Association.
A Divisive Issue
Public attitudes on gun laws are far from homogenous. There are sharp differences in support for stricter gun control according to gender, race, region of the country, political ideology, and party identification. Attitudes are also sharply different between gun owners and non-gun owners -- a distinction that, to some degree, overlaps with gender and party ID.
As seen in the accompanying table, a majority of men favor keeping gun laws as they are or making them less strict, while a majority of women favor making them stricter. Whites are closely split over the question, while a solid majority of nonwhites favor stricter laws. A majority of residents in the East and West favor stricter laws, while about half of those in the Midwest and South hold the alternate views. Compared with those in urban and suburban areas, residents of rural areas are also less in favor of stricter laws. Two-thirds of Democrats favor stricter gun laws, while a majority of Republicans and independents would rather they remain as they are or become less strict. Three-quarters of gun owners take one of the two more lenient positions on gun laws, while nearly as many non-gun owners favor stricter laws.
|
Preference for Laws Governing Sale of Firearms
|
|||
|
More
|
Same/
|
Net More
|
|
|
% |
% |
% |
|
|
Men |
42 |
57 |
-15 |
|
Women |
60 |
37 |
23 |
|
|
|
|
|
|
Whites |
47 |
51 |
-4 |
|
Nonwhites |
65 |
34 |
31 |
|
|
|
|
|
|
East |
60 |
38 |
22 |
|
Midwest |
46 |
51 |
-5 |
|
South |
47 |
51 |
-4 |
|
West |
54 |
44 |
10 |
|
|
|
|
|
|
Urban |
56 |
42 |
14 |
|
Suburban |
52 |
46 |
6 |
|
Rural |
40 |
57 |
-17 |
|
|
|
|
|
|
Republicans |
42 |
57 |
-15 |
|
Independents |
43 |
54 |
-11 |
|
Democrats |
68 |
30 |
38 |
|
|
|
|
|
|
Gun in household |
24 |
75 |
-51 |
|
No gun in household |
62 |
35 |
27 |
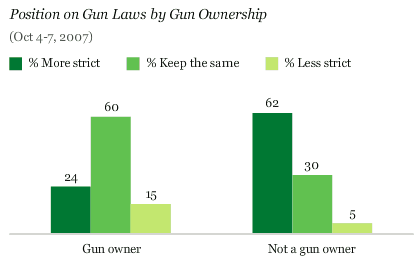
Most of those not in favor of stricter gun laws fall into the "keep laws the same" category, rather than the "make them less strict" category. This is even the case among gun owners.
|
Position on Gun Laws by Gun Ownership
|
||
|
Gun owner |
Not a
|
|
|
% |
% |
|
|
More strict |
24 |
62 |
|
Keep the same |
60 |
30 |
|
Less strict |
15 |
5 |
|
No opinion |
1 |
2 |
Support for stricter gun control laws has declined by 11 points since the recent high water mark in 1993. The decline over this time period is roughly the same in most major demographic groups. There are two exceptions to this general pattern: Republicans and those living in the West, whose views have essentially not changed.
|
Trend in Percentage Favoring "More Strict" Laws Governing Sale of Firearms |
|||
|
May 2000 |
Oct. 2007 |
Change |
|
|
% |
% |
Pct. Pts. |
|
|
National Adults |
62 |
51 |
-11 |
|
|
|
|
|
|
Men |
52 |
42 |
-10 |
|
Women |
72 |
60 |
-12 |
|
|
|
|
|
|
Whites |
61 |
47 |
-14 |
|
Nonwhites |
74 |
65 |
-9 |
|
|
|
|
|
|
East |
76 |
60 |
-16 |
|
Midwest |
59 |
46 |
-13 |
|
South |
59 |
47 |
-12 |
|
West |
57 |
54 |
-3 |
|
|
|
|
|
|
Urban |
67 |
56 |
-11 |
|
Suburban |
65 |
52 |
-13 |
|
Rural |
53 |
40 |
-13 |
|
|
|
|
|
|
Republicans |
44 |
42 |
-2 |
|
Independents |
61 |
43 |
-18 |
|
Democrats |
81 |
68 |
-13 |
|
|
|
|
|
|
Gun in household |
40 |
24 |
-16 |
|
No gun in household |
76 |
62 |
-14 |
Bottom Line
Gun control has not surfaced as a major -- or even a minor -- issue thus far in the 2008 presidential campaign. The most that's been said is that the issue is hardly even being debated. The Gallup trends reviewed help to explain why. With public support for stricter gun laws waning after 9/11, the political climate for championing gun control is indeed different from when the Brady Bill was passed in 1993. Although half of Americans do say they favor stricter gun laws today, this is well below the 70% found in 1993. And when public attitudes about banning guns and enforcement are probed, there appears to be even less public demand for gun control.
Results are based on telephone interviews with 1,010 national adults, aged 18 and older, conducted Oct. 4-7, 2007. For results based on the total sample of national adults, one can say with 95% confidence that the maximum margin of sampling error is ±3 percentage points.
In addition to sampling error, question wording and practical difficulties in conducting surveys can introduce error or bias into the findings of public opinion polls.
|
20. In general, do you feel that the laws covering the sale of firearms should be made more strict, less strict, or kept as they are now? |
||||
|
More
|
Less
|
Kept
|
No
|
|
|
% |
% |
% |
% |
|
|
2007 Oct 4-7 |
51 |
8 |
39 |
2 |
|
|
|
|
|
|
|
2006 Oct 9-12 |
56 |
9 |
33 |
2 |
|
2005 Oct 13-16 |
57 |
7 |
35 |
1 |
|
2004 Oct 11-14 |
54 |
11 |
34 |
1 |
|
2004 Jan 9-11 |
60 |
6 |
34 |
* |
|
2003 Oct 6-8 |
55 |
9 |
36 |
* |
|
2002 Oct 14-17 |
51 |
11 |
36 |
2 |
|
2001 Oct 11-14 |
53 |
8 |
38 |
1 |
|
2000 May 5-7 |
62 |
5 |
31 |
2 |
|
2000 Apr 7-9 |
61 |
7 |
30 |
2 |
|
1999 Dec 9-12 |
60 |
10 |
29 |
1 |
|
1999 Aug 3-4 |
66 |
6 |
27 |
1 |
|
1999 Jun 25-27 |
62 |
6 |
31 |
1 |
|
1999 May 23-24 |
65 |
5 |
28 |
2 |
|
1999 Apr 26-27 |
66 |
7 |
25 |
2 |
|
1999 Feb 8-9 |
60 |
9 |
29 |
2 |
|
1995 Apr 23-24 ^ |
62 |
12 |
24 |
2 |
|
1993 Dec 17-19 |
67 |
7 |
25 |
1 |
|
1993 Mar 12-14 |
70 |
4 |
24 |
2 |
|
1991 Mar 21-24 |
68 |
5 |
25 |
2 |
|
1990 Sep 10-11 |
78 |
2 |
17 |
3 |
|
^ Asked of half sample. |
||||
|
21. Do you think there should or should not be a law that would ban the possession of handguns, except by the police and other authorized persons? |
|||
|
|
Should be |
Should
|
No
|
|
% |
% |
% |
|
|
2007 Oct 4-7 |
30 |
68 |
2 |
|
|
|
|
|
|
2006 Oct 9-12 |
32 |
66 |
2 |
|
2005 Oct 13-16 |
35 |
64 |
1 |
|
2004 Oct 11-14 |
36 |
63 |
1 |
|
2003 Oct 6-8 |
32 |
67 |
1 |
|
2002 Oct 14-17 |
32 |
65 |
3 |
|
2000 Aug 29-Sep 5 |
36 |
62 |
2 |
|
1999 Apr 26-27 |
38 |
59 |
3 |
|
1999 Feb 8-9 |
34 |
64 |
2 |
|
1993 Dec 17-19 |
39 |
60 |
1 |
|
1993 Mar 12-14 |
42 |
54 |
4 |
|
1991 Mar 21-24 |
43 |
53 |
4 |
|
1990 Sep 10-11 |
41 |
55 |
4 |
|
1988 Jul 1-7 |
37 |
59 |
4 |
|
1987 Oct |
42 |
50 |
8 |
|
1981 Jun |
41 |
54 |
5 |
|
1981 Apr |
39 |
58 |
3 |
|
1980 Dec |
38 |
51 |
11 |
|
1980 Jan |
31 |
65 |
4 |
|
1975 |
41 |
55 |
4 |
|
1965 |
49 |
44 |
7 |
|
1959 |
60 |
36 |
4 |
|
|
|||
|
|
Enforce current
|
Pass new laws
|
|
|
% |
% |
% |
|
|
2007 Oct 4-7 |
58 |
38 |
4 |
|
|
|
|
|
|
2006 Oct 9-12 |
53 |
43 |
4 |
|
2002 Feb 8-10 |
60 |
38 |
2 |
|
2000 Aug 29-Sep 5 |
53 |
45 |
2 |
|
2000 Apr 28-30 ^ |
51 |
44 |
5 |
|
^ Asked of half sample. |
|||
Now, thinking about your own situation,
23. Do you have a gun in your home?
|
|
|
No
|
|
|
|
No
|
||
|
% |
% |
% |
|
% |
% |
% |
||
|
2007 Oct 4-7 |
42 |
57 |
1 |
|
1993 Dec 17-21 |
49 |
50 |
* |
|
|
|
|
|
1993 Oct 13-18 |
51 |
48 |
1 |
|
|
2006 Oct 9-12 |
43 |
54 |
3 |
|
1993 Mar 12-14 |
48 |
51 |
1 |
|
2005 Oct 13-16 |
40 |
59 |
1 |
|
1991 May 16-19 |
46 |
53 |
1 |
|
2004 Oct 11-14 |
38 |
61 |
1 |
|
1991 Mar 21-24 |
48 |
51 |
1 |
|
2003 Oct 6-8 |
43 |
56 |
1 |
|
1990 Sep 10-11 |
47 |
52 |
1 |
|
2002 Oct 14-17 |
41 |
58 |
1 |
|
1989 Feb 28-Mar 2 |
47 |
51 |
2 |
|
2001 Oct 11-14 |
40 |
59 |
1 |
|
1985 Apr 12-15 |
44 |
55 |
1 |
|
2000 Aug 29-Sep 5 |
39 |
60 |
1 |
|
1983 May 13-16 |
40 |
58 |
2 |
|
2000 Apr 7-9 |
42 |
57 |
1 |
|
1980 Jan 2 |
45 |
53 |
2 |
|
1999 Apr 26-27 |
34 |
64 |
2 |
|
1975 Oct 3-6 |
44 |
54 |
2 |
|
1999 Feb 8-9 |
36 |
62 |
2 |
|
1972 May 23 |
43 |
55 |
2 |
|
1997 Aug 22-25 |
42 |
57 |
1 |
|
1968 |
50 |
50 |
-- |
|
1996 Nov 21-24 |
44 |
54 |
2 |
|
1965 Jan 7-12 |
48 |
52 |
-- |
|
1996 Jul 25-28 |
38 |
60 |
2 |
|
1959 Jul 23-28 |
49 |
51 |
-- |
24. Do you have a gun anywhere else on your property such as in your garage, barn, shed or in your car or truck?
COMBINED RESPONSES (Q.23-24)
|
Gun
|
Gun else-
|
No
|
No
|
|
|
% |
% |
% |
% |
|
|
2007 Oct 4-7 |
42 |
2 |
55 |
1 |
|
|
|
|
|
|
|
2005 Oct 13-16 |
40 |
2 |
57 |
1 |
|
2004 Oct 11-14 |
38 |
2 |
59 |
1 |
|
2003 Oct 6-8 |
43 |
2 |
54 |
1 |
|
2002 Oct 14-17 |
41 |
3 |
55 |
1 |
|
2000 Aug 29-Sep 5 |
39 |
2 |
58 |
1 |
|
1999 Feb 8-9 |
36 |
6 |
56 |
2 |
|
1996 Nov 21-24 |
44 |
1 |
53 |
2 |
|
1996 Jul 25-28 |
38 |
2 |
58 |
2 |
|
1993 Dec 17-21 |
49 |
5 |
45 |
* |
|
1991 May 16-19 |
46 |
4 |
49 |
1 |
25. Do you personally own a gun, or do the gun or guns in your household belong to another household member?
COMBINED RESPONSES (Q.23-25)
|
|
Other household
|
|
|
|
|
% |
% |
% |
% |
|
|
2007 Oct 4-7 |
28 |
16 |
55 |
1 |
|
|
|
|
|
|
|
2005 Oct 13-16 |
30 |
12 |
57 |
1 |
|
2000 Aug 29-Sep 5 |
27 |
14 |
58 |
1 |