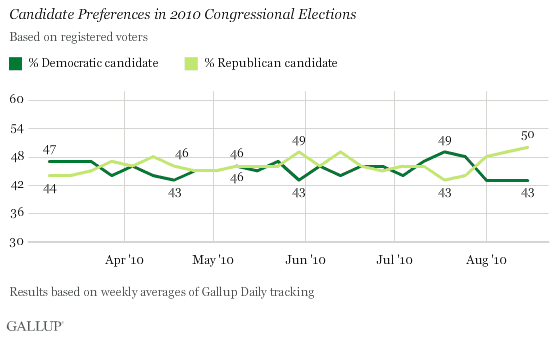
PRINCETON, NJ -- Gallup's latest update on 2010 congressional voting preferences finds 50% of registered voters saying they would vote for the Republican candidate in their district, and 43% for the Democratic candidate, if the elections were held today. Republicans have led in each of the past three weeks, and their current 50% vote share and seven percentage-point lead represent their best showings thus far in 2010.

These results are based on aggregated data from Gallup Daily tracking conducted Aug. 9-15. Registered voters' preferences have been fairly closely divided for much of the time since Gallup began tracking 2010 congressional election voting preferences in March. Democrats appeared to be gaining some positive momentum in July, but in recent weeks Republicans have moved out ahead.
Republicans typically turn out to vote in greater numbers than Democrats do. So their current seven-point advantage among all registered voters could represent the lower bound of the margin they could expect to win by (in the national two-party vote) if the elections were held today.
A strong Republican showing this fall would be consistent with Gallup's recent research indicating that the party of a president with approval ratings below 50% tends to suffer heavy seat losses in midterm elections. The Republicans' larger lead on the latest generic ballot coincides with a new low weekly job approval average of 44% for President Obama.
In addition to -- or perhaps because of -- increasing disappointment with the president, Republicans owe their renewed strength in August to two factors: greater parity with the Democrats in Americans' political affiliation and slightly more support for Republican congressional candidates from independent voters.
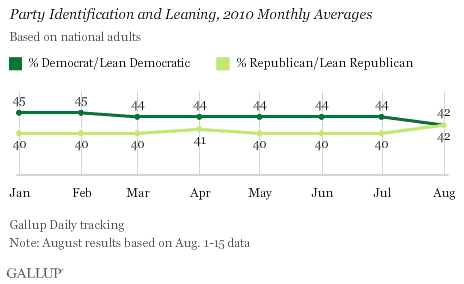
Gallup Daily tracking thus far in August finds the same percentage of all Americans identifying themselves as Republican or saying they lean to the Republican Party (42%) as identify or lean Democratic (42%). The Democrats had enjoyed a consistent advantage on this measure of political affiliation from January through July 2010.

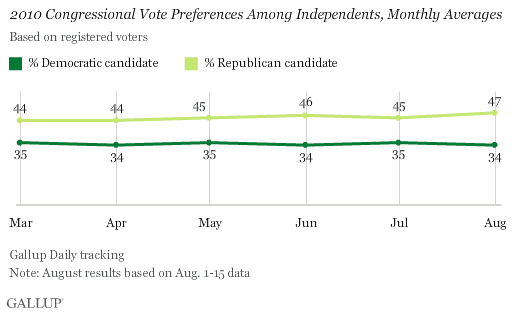
Also, in August to date, the vote among independent registered voters has averaged 47% Republican to 34% Democratic, a 13-point GOP advantage. That compares with an average 10-point Republican advantage prior to this month.

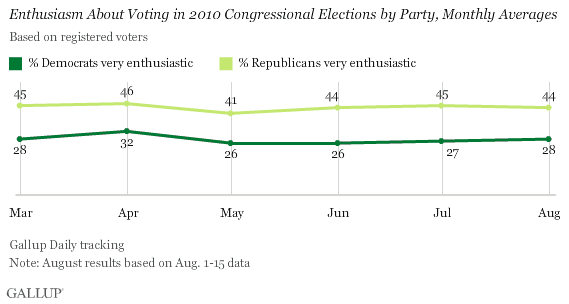
One area in which Republicans have appeared not to gain in August is reported voter enthusiasm about voting. Although they maintain a large advantage -- 44% of Republicans say they are very enthusiastic about voting this year, compared with 28% of Democrats -- that gap had been slightly larger in prior months, including July.

Regardless of the size of the gap, the continuing Republican advantage in enthusiasm is a positive sign for the party's hopes in the fall elections. Gallup analysis of historical data has found that the party with an advantage in midterm voter enthusiasm generally gains seats in that fall's elections. However, that does not appear to be a direct result of higher turnout among the more enthusiastic party's supporters. Rather, the party that leads in enthusiasm is more likely to make gains in the percentage of Americans who affiliate with that party, as occurred for the Republican Party in 1994 and 2002 and for the Democratic Party in 2006, and appears to be happening for the GOP this year.
Results are based on telephone interviews conducted as part of Gallup Daily tracking survey Aug. 9-15, 2010, with a random sample of 1,662 registered voters, aged 18 and older, living in all 50 U.S. states and the District of Columbia, selected using random-digit-dial sampling.
For results based on the total sample of registered voters, one can say with 95% confidence that the maximum margin of sampling error is ±4 percentage points.
Interviews are conducted with respondents on landline telephones and cellular phones, with interviews conducted in Spanish for respondents who are primarily Spanish-speaking. Each daily sample of national adults includes a minimum quota of 150 cell phone respondents and 850 landline respondents, with additional minimum quotas among landline respondents for gender within region. Landline respondents are chosen at random within each household on the basis of which member had the most recent birthday.
Samples are weighted by gender, age, race, Hispanic ethnicity, education, region, adults in the household, cell phone-only status, cell phone-mostly status, and phone lines. Demographic weighting targets are based on the March 2009 Current Population Survey figures for the aged 18 and older non-institutionalized population living in U.S. telephone households. All reported margins of sampling error include the computed design effects for weighting and sample design.
In addition to sampling error, question wording and practical difficulties in conducting surveys can introduce error or bias into the findings of public opinion polls.
For more details on Gallup's polling methodology, visit www.gallup.com.
