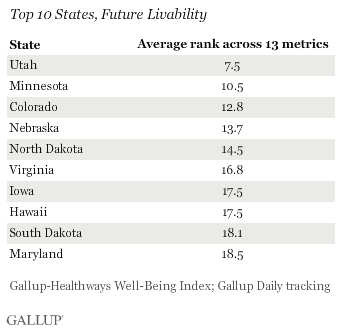
WASHINGTON, D.C. -- Utah easily leads the nation in terms of its performance across 13 forward-looking metrics that might determine which states will be the best places to live in the future. Minnesota, Colorado, Nebraska, and North Dakota round out the top five.
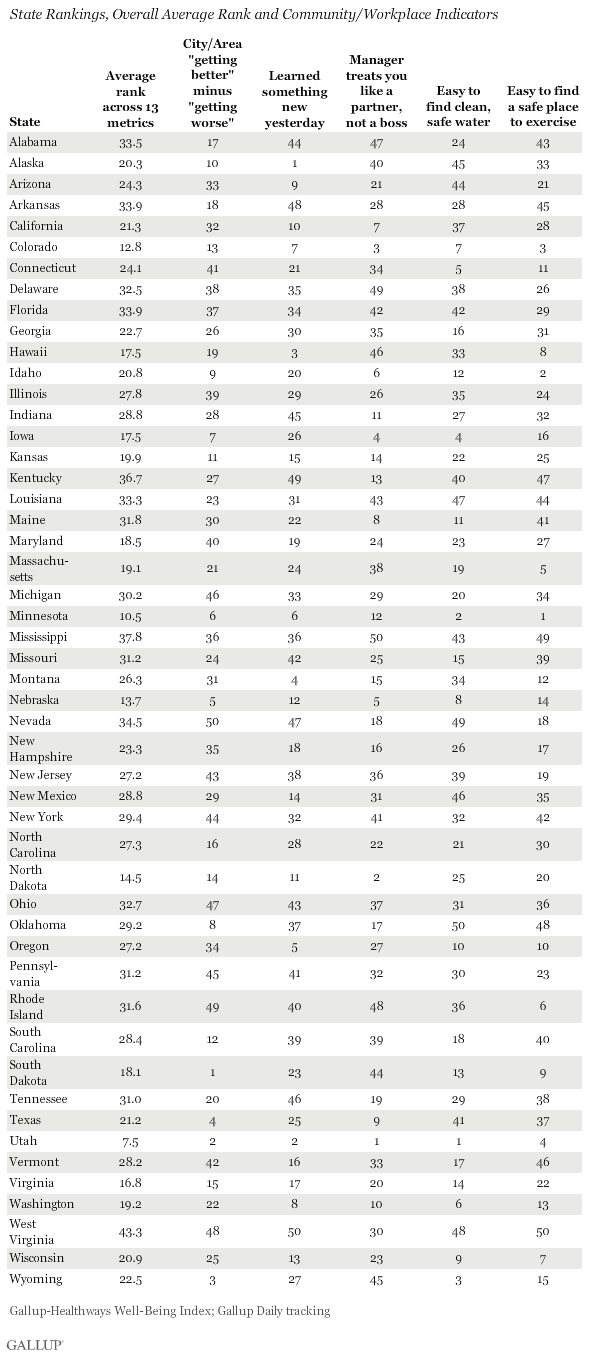
Utah does best in part because it is among the top two best-performing states for low smoking habits, ease of finding clean and safe water, having supervisors who treat workers like a partner rather than a boss, learning something new or interesting on any given day, and perceptions that your city or area are "getting better" rather than "getting worse."
These are five of 13 metrics encompassing economic, workplace, community, and personal choices Gallup used to assess the future livability of 50 states. The findings are based on the results of over 530,000 interviews with U.S. adults conducted Jan. 2, 2011, through June 30, 2012, as a part of Gallup Daily tracking and the Gallup-Healthways Well-Being Index. Previous results focusing on the best future region in the U.S. recently appeared in Business Insider as well as Gallup.com and the Gallup Business Journal.
The remaining eight metrics include evaluations of one's life five years from now, economic confidence, job creation, standard of living momentum, obesity, ease of finding a safe place to exercise, visits to the dentist, and the percentage of workers employed full time for an employer. The selection of the 13 metrics was not based on any statistical model, but rather on their presumed relevance to future livability. Each metric contributed equally to the final ranking.
Southern States Not Well Positioned Future Livability
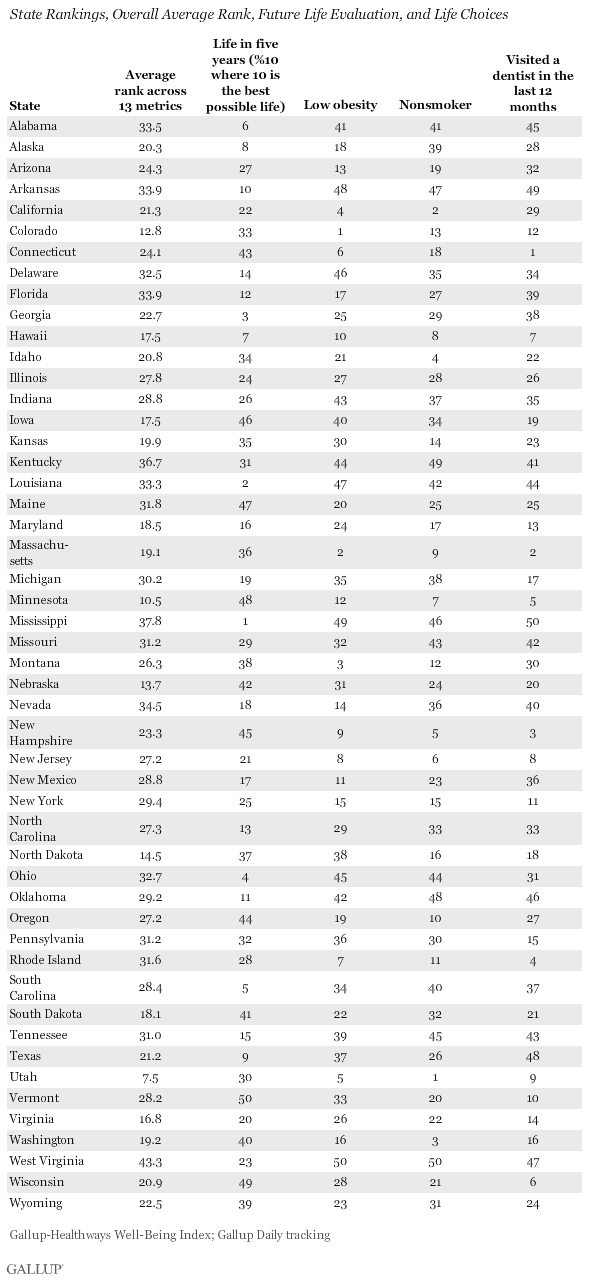
West Virginia, followed by Mississippi and Kentucky, are the three states with the lowest overall average ranking across the 13 metrics. West Virginia is ranked last in the country for five of them: economic confidence, learning new and interesting things daily, ease of finding a safe place to exercise, obesity, and smoking. Residents of Mississippi are last in the U.S. for being employed full time by an employer, annual visits to the dentist, and having a supervisor that treats you like a partner rather than a boss. All three states are in the bottom 10 for economic confidence, smoking, obesity, ease of finding clean and safe water, dental visits, and ease of finding a safe place for residents to exercise.
Nevada is last in "city/area 'getting better' minus 'getting worse'" and 49th in providing its residents with clean and safe water, while residents of Maine have the worst standard of living momentum.
Utah, Minnesota, and North Dakota Lead Two Metrics Each
Utah sets the national standard for smoking, for workers being treated as partners by their supervisors, and for ease of finding clean, safe water. Meanwhile, North Dakota maintains strong economic indicators and Hawaii tops all the states in standard of living. Elsewhere, residents of Mississippi anticipate the best life in five years and Minnesotans find it easiest to locate a safe place to exercise. Colorado leads all states with the lowest obesity, and residents of Connecticut are the most likely to have visited a dentist in the last 12 months. South Dakotans are more likely to see their cities/areas getting better than residents of any other state.
Bottom Line
Clearly, the future livability of any given state is not yet determined. Leaders and residents alike have a keen opportunity right now to set the foundation for creating a place where people will want to live. By focusing on the metrics that have the most impact on forthcoming economic, health, and social well-being outcomes, leaders will be able to realize the greatest return on their investment.
See page 2 for more on how the rankings were computed, and see the tables on page 3 for the full state rankings.
Why Each Metric Was Chosen and How the Rankings Were Computed:
The findings are based over 530,000 interviews with U.S. adults conducted since the start of 2011 on the following metrics measured as part of the Gallup Daily tracking, including the Gallup-Healthways Well-Being Index:
- Full-Time Employment for an Employer: Gallup finds that full-time employment, or "good jobs," with employers is linked to higher GDP and improved well-being. Regions that can create these jobs and attract great talent to fill them will be best positioned for economic growth.
- Economic Confidence Index: In regions where there is higher economic confidence, residents are more optimistic about where the economy is now and where it is headed in the future.
- Job Creation Index: In regions with higher Job creation Index scores, employees report much more hiring than firing in their workplace, positioning the region for strong economic growth.
- Supervisor Relationship: A key element in work environment well-being, being partnered with rather than bossed around at work, lays a foundation for higher employee engagement and productivity, as well as improved emotional and physical health.
- Standard of Living Optimism: Where people are more likely to say their standard of living is getting better, there is often higher economic confidence, lower unemployment, and higher life evaluation.
- City Optimism: Where people are more likely to say their city or area is getting better as a place to leave, there is often lower unemployment, better environmental quality, and greater satisfaction with the community as a place to live.
- Daily Learning: Learning something new and interesting daily is a critical psychological need and one of the most prevalent commonalities of high well-being communities.
- Easy Access to Clean, Safe Water: Essential for human survival, safe water is closely linked to the physical environment, many sectors of the economy, and to community well-being.
- Easy Access to a Safe Place to Exercise: Communities with the greatest access to safe places to exercise have lower obesity and related chronic conditions, as well as lower per capita crime rates.
- Obesity: Where there are more obese people, there are higher mortality rates, more chronic conditions, and higher healthcare costs.
- Smoking: Where there are more smokers, there are higher mortality rates, substantially higher risk of coronary heart disease, stroke, lung cancer, lung disease, heart disease, and aortic aneurysms, among other cancers and conditions.
- Dentist Visits: While no longer officially linked to future heart attack and stroke, poor oral health has been associated with periodontal disease, atherosclerosis, rheumatoid arthritis, diabetes, preterm deaths, and erectile dysfunction.
- Future Life Evaluation: Where residents are optimistic about their life in five years, there is more optimism.
Survey Methods
Results are based on telephone interviews conducted as part of Gallup Daily tracking/the Gallup-Healthways Well-Being Index survey, Jan. 2, 2011, through June 30, 2012, with a random sample of 531,154 adults, aged 18 and older, living in all 50 U.S. states and the District of Columbia.
For results based on each state sample, one can say with 95% confidence that the maximum margin of sampling error is about ±3 percentage points for small states such as Alaska (n=1,428), Hawaii (n=1,552), and Vermont (n=1,753), and less than ±1 percentage point for large states such as California (n=49,314), New York (n=27,620), and Florida (n=28,055).
Interviews are conducted with respondents on landline telephones and cellular phones, with interviews conducted in Spanish for respondents who are primarily Spanish-speaking. Each sample includes a minimum quota of 400 cell phone respondents and 600 landline respondents per 1,000 national adults, with additional minimum quotas among landline respondents by region. Landline telephone numbers are chosen at random among listed telephone numbers. Cell phones numbers are selected using random digit dial methods. Landline respondents are chosen at random within each household on the basis of which member had the most recent birthday.
Samples are weighted by gender, age, race, Hispanic ethnicity, education, region, adults in the household, and phone status (cell phone-only/landline only/both, cell phone mostly, and having an unlisted landline number). Demographic weighting targets are based on the March 2011 Current Population Survey figures for the aged 18 and older non-institutionalized population living in U.S. telephone households. All reported margins of sampling error include the computed design effects for weighting and sample design.
The Standard of Living question reported here was asked of a random half-sample of respondents for the same period on the Gallup Daily tracking survey. Obesity is based on respondents' self-report of their height and weight, which are used to calculate Body Mass Index (BMI) scores. Americans who have a BMI of 30 or higher are classified as "obese".
In addition to sampling error, question wording and practical difficulties in conducting surveys can introduce error or bias into the findings of public opinion polls.
For more details on Gallup's polling methodology, visit www.gallup.com.
