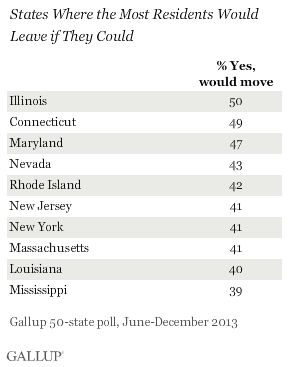
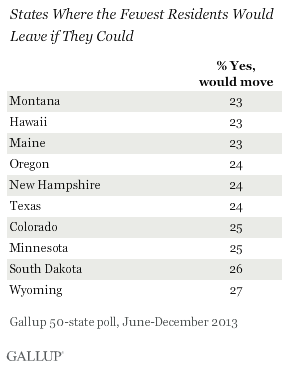
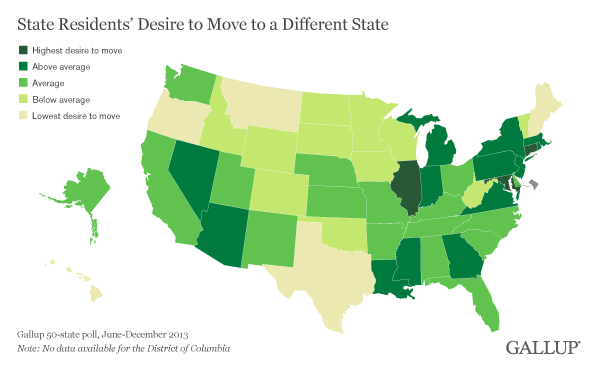
PRINCETON, NJ -- Every state has at least some residents who are looking for greener pastures, but nowhere is the desire to move more prevalent than in Illinois and Connecticut. In both of these states, about half of residents say that if given the chance to move to a different state, they would like to do so. Maryland is a close third, at 47%. By contrast, in Montana, Hawaii, and Maine, just 23% say they would like to relocate. Nearly as few -- 24% -- feel this way in Oregon, New Hampshire, and Texas.
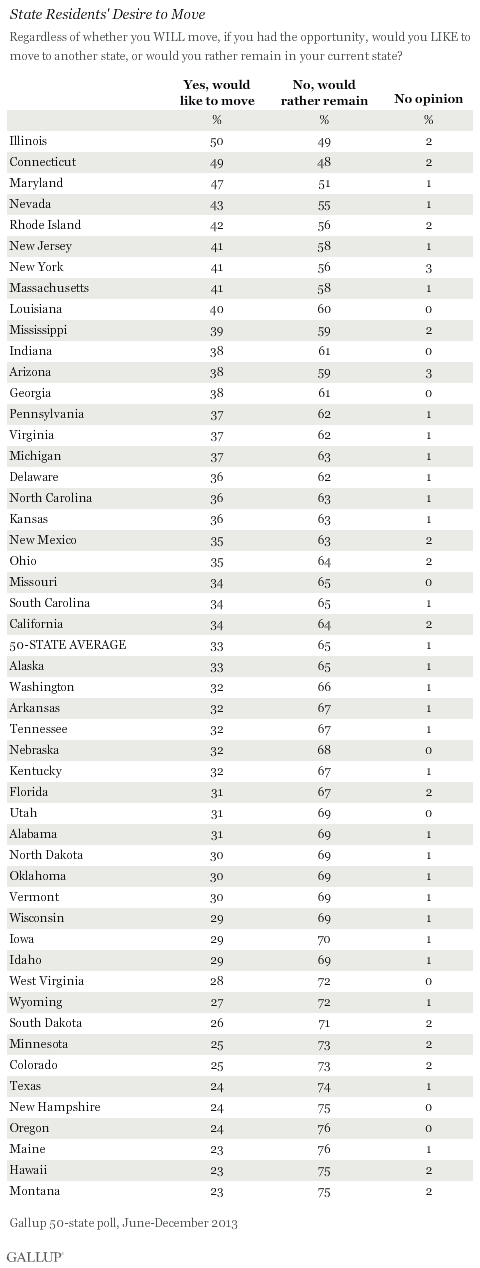
These findings are from a 50-state Gallup poll, conducted June-December 2013, which includes at least 600 representative interviews with residents aged 18 and older in each state. Gallup measured residents' interest in moving out of state by asking, "Regardless of whether you will move, if you had the opportunity, would you like to move to another state, or would you rather remain in your current state?"
Thirty-three percent of residents want to move to another state, according to the average of the 50 state responses. Seventeen states come close to that 50-state average. Another 16 are above the average range, including three showing an especially high desire to move. In fact, in these three -- Illinois, Connecticut, and Maryland -- roughly as many residents want to leave as want to stay.
At the other end of the spectrum, 17 states are home to a below-average percentage of residents wanting to leave. This includes the previously mentioned six states -- Montana, Hawaii, Maine, Oregon, New Hampshire, and Texas -- where fewer than one in four want to move, the lowest level recorded. The detailed results for all 50 states are shown on page 2.
Nevada Residents Show Greatest Intention to Move in Next 12 Months
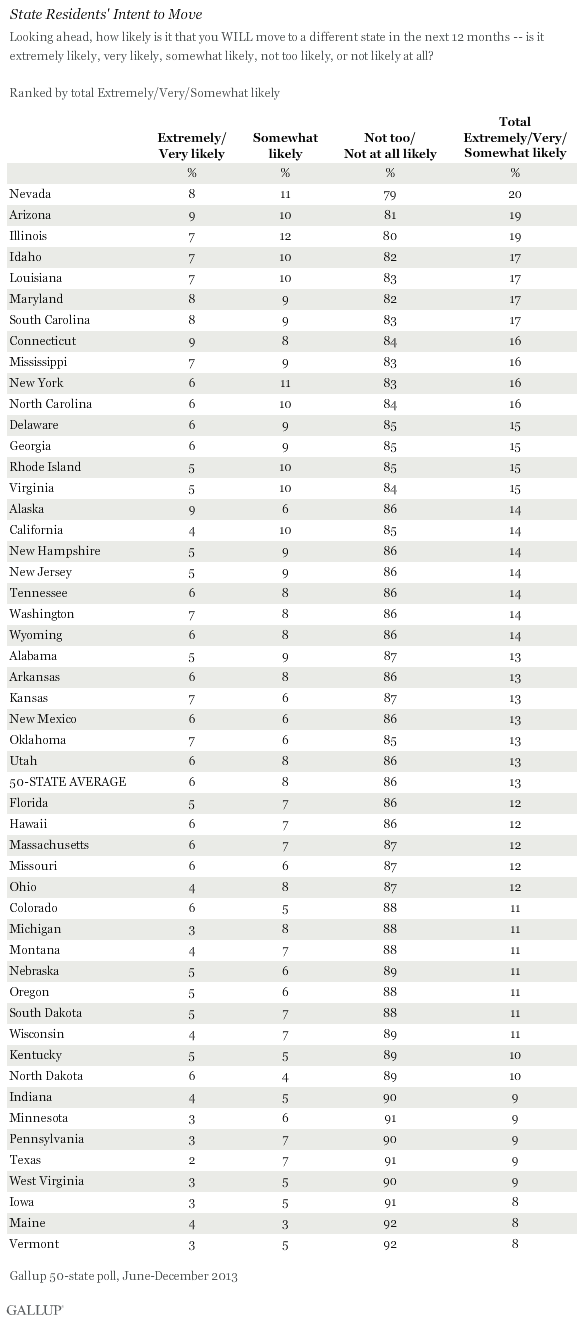
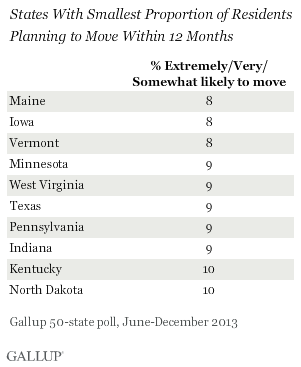
In the same poll, Gallup asked state residents how likely it is they will move in the next 12 months. On average across all 50 states, 6% of state residents say it is extremely or very likely they will move in the next year, 8% say it is somewhat likely, 14% not too likely, and 73% not likely at all.
The combined percentages reporting they are extremely, very, or somewhat likely to move out of state ranges from 8% in Maine, Iowa, and Vermont to 20% in Nevada. Although these figures are still high relative to the actual percentage of Americans who move out of state each year, they provide a basis for evaluating each state's risk of losing population that is somewhat stronger than the sheer desire of its residents to move.

Of course, all states enjoy an influx of new residents as well as outflows, so these intention-to-move data are only part of the population-change picture, but an important one.
Those saying it is at least somewhat likely they will move were asked to say why, in their own words. The biggest factor residents give for planning to move is for work or business reasons -- the 50-state average is 31%. This is followed by family or other social reasons (19%), weather or location (11%), and then seeking a better quality of life or change (9%).
In most states, it is not possible to view these answers because there are too few respondents, but in each of the 11 states with the highest percentages wanting to leave, roughly 100 answered the question. The breakdown of the open-ended responses for these 11 states is shown in the accompanying graph.
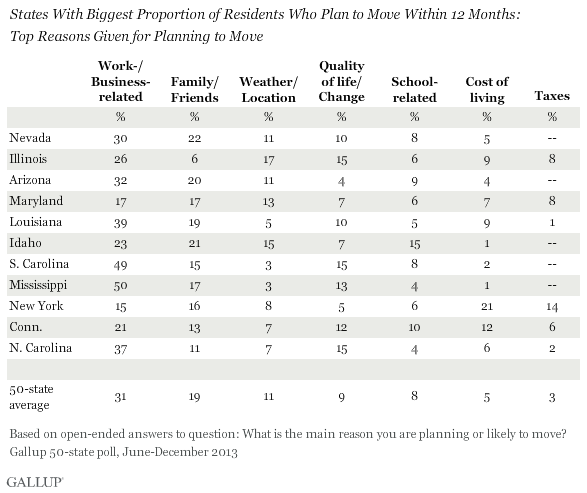
While not all of the percentage differences among the states are statistically significant because of small sample sizes, a few important ones stand out. Residents of Mississippi and South Carolina who indicate they are likely to move are significantly more likely to cite work- or business-related reasons than are their counterparts in other states. The cost of living is a greater relative factor for residents in Connecticut and New York, while taxes are a uniquely important factor in New York, Illinois, and Maryland.
Bottom Line
State leaders have important reasons for wanting to see their state populations grow rather than shrink. A growing population usually means more commerce, more economic vitality, and a bigger tax base to pay for state services. A shrinking population not only hurts government coffers, but can weaken a state politically by virtue of the potential loss of U.S. House members through redistricting every 10 years.
Gallup's 50-state poll finds some states far better positioned than others to retain residents, and thus possibly attract new ones. This is evident in the wide variation in the percentages of state residents who say they would leave their state if they could, as well as in the percentages who say they plan to move in the next year.
Nevada, Illinois, Maryland, Louisiana, Mississippi, New York, and Connecticut all appear particularly vulnerable to losing population in the coming few years: high percentages of their residents say they would leave if they could, and larger-than-average percentages say they are at least somewhat likely to do so in the coming year. At the other end of the spectrum, Texas, Minnesota, and Maine have little to fear. Residents of these states are among the least likely to want to leave and few are planning to leave in the next 12 months.
If these states sound familiar to readers of Gallup's previous 50-state poll articles, it's because several of them also appear at the top or bottom of the states for resident satisfaction with state taxes, state government, and overall perceptions of how their state compares to others as a place to live. Texas is in the top 10 on all three, while Illinois, Rhode Island, and Maryland rank in the bottom 10 on all three.
In upcoming articles, Gallup will analyze interstate migration patterns in greater detail, looking at where residents who are likely to move say they would move to.
Survey Methods
Results for this Gallup poll are based on telephone interviews conducted June-December 2013, with a random sample of approximately 600 adults in each state, aged 18 and older, living in all 50 U.S. states and the District of Columbia.
For results based on the total sample of adults per state, the margin of sampling error is ±5 percentage points at the 95% confidence level.
Interviews are conducted with respondents on landline telephones and cellular phones, with interviews conducted in Spanish for respondents who are primarily Spanish-speaking. Each sample of national adults includes minimum quotas of cellphone respondents and landline respondents based on cellphone and landline use in the respective state. Landline and cellular telephone numbers are selected using random-digit-dial methods. Landline respondents are chosen at random within each household on the basis of which member had the most recent birthday.
Samples are weighted to correct for unequal selection probability, nonresponse, and double coverage of landline and cell users in the two sampling frames. They are also weighted to match the state demographics of gender, age, race, Hispanic ethnicity, education, region, population density, and phone status (cellphone only/landline only/both, and cellphone mostly). Demographic weighting targets are based on the most recent Current Population Survey figures for the aged 18 and older U.S. population. Phone status targets are based on the most recent National Health Interview Survey. Population density targets are based on the most recent U.S. census. All reported margins of sampling error include the computed design effects for weighting.
In addition to sampling error, question wording and practical difficulties in conducting surveys can introduce error or bias into the findings of public opinion polls.
For more details on Gallup's polling methodology, visit www.gallup.com.