Story Highlights
- Conservatives remain largest ideological group, at 38%
- Liberals up one point to 24%, the highest yet
- Conservative-liberal gap now smallest in Gallup trends
PRINCETON, N.J. -- Conservatives continued to outnumber moderates and liberals in the U.S. population in 2014, as they have since 2009. However, their 14-percentage-point edge over liberals last year, 38% vs. 24%, is the smallest in Gallup's trends since 1992. The percentage of U.S. adults identifying themselves as politically conservative in 2014 was unchanged from 2013, as was the percentage of moderates, at 34%, while the percentage considering themselves liberal rose a percentage point for the third straight year.
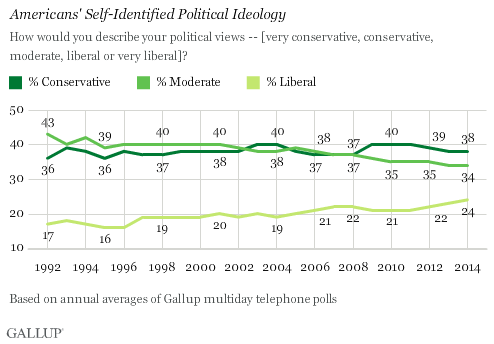
When Gallup initiated this measure of self-identified political ideology in 1992, the largest group of Americans called themselves moderate, while slightly more than one-third identified as conservative and fewer than one in five as liberal. The conservative-liberal gap at that time was 19 points, and by 1996 it had widened to 22 points, its highest across the trend. Since then, the liberal percentage has swelled and the percentage of moderates has shrunk from 40% to 34%.
These results are based on combined data from Gallup's standalone surveys of U.S. adults, totaling between 16,000 and 45,000 interviews for each year.
Political Polarization Inched Further Ahead in 2014
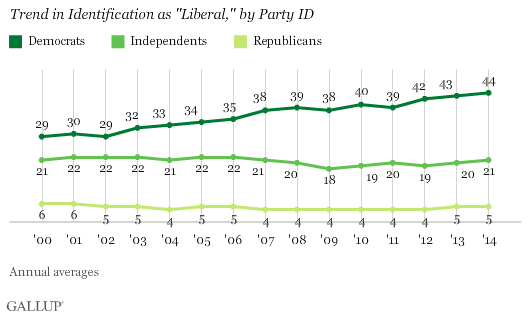
The one-point uptick in the percentage liberal in 2014 stems from one-point increases in liberal self-identification among both independents and Democrats. The small percentage of Republicans identifying as liberals stayed the same. Longer term, since 2000, all of the rise in liberalism on this measure is owing to Democrats.
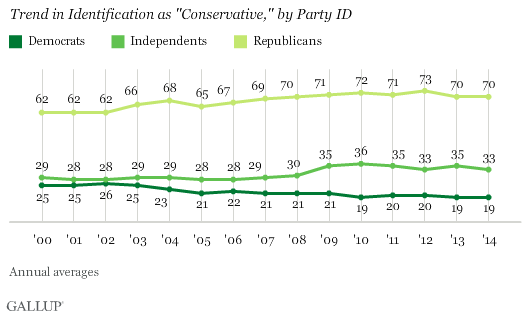
At the same time, Republicans' strong tendency to identify with the conservative moniker stayed the same in 2014 at 70%, just under the 73% high point reached in 2012. The percentage of Republicans who consider themselves conservative remains slightly higher today than it was through the mid-2000s,and the pattern is nearly the same with independents. At the same time, fewer Democrats call themselves conservative compared with a decade ago.
Over time, the growth of liberals and conservatives has come at the expense of moderates, a group that has been shrinking as a proportion of every party group, but particularly Republicans and Democrats. While moderates gained a point back among independents and Republicans in 2014, they remain below their recent highs.
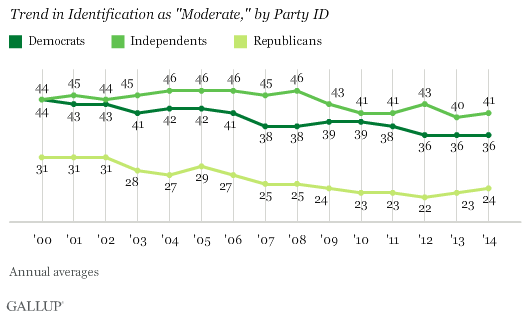
As evident in a thorough review of these trends in 2014, moderates still represent the largest segment of independents. Since 2010, Democrats have been more likely to identify as liberals than as moderates. Conservatives continue to dominate Republicans' ranks.
Bottom Line
Over the past 22 years, Americans' ideological bent, or at least their willingness to associate with certain labels, has changed in subtle ways. Although the "liberal" moniker remains the least favorite, it has enjoyed the most growth, while "conservative" is up slightly and "moderate" has waned. But to a large extent, these changes reflect opposing ideological shifts within the parties, not national trends. That helps explain how there could be a record proportion of liberals at a time when Democratic identification was at a long-term low. Likewise, even though 2014 was a strong election year for the Republican Party, Gallup found no increase in conservatism in 2014 compared with 2013. All of this happened at the same time that political independence was peaking, which is to say that ideological polarization and the strength of the two major parties don't necessarily go hand in hand. In fact, one may undermine the other.
Survey Methods
Results are based on aggregated telephone interviews from 15 separate Gallup polls conducted in 2014, with a random sample of 16,479 adults, aged 18 and older, living in all 50 U.S. states and the District of Columbia.
For results based on the total sample of national adults, the margin of sampling error is ±1 percentage point at the 95% confidence level.
Each sample of national adults includes a minimum quota of 50% cellphone respondents and 50% landline respondents, with additional minimum quotas by time zone within region. Landline and cellular telephone numbers are selected using random-digit-dial methods.
Learn more about how Gallup Poll Social Series works.