Story Highlights
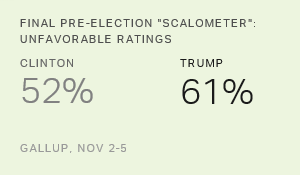
- Trump's 61% unfavorable score is worst in presidential polling history
- Clinton's 52% unfavorable score is second-worst
- Candidates roughly matched in highly unfavorable images
PRINCETON, N.J. -- Donald Trump and Hillary Clinton head into the final hours of the 2016 presidential campaign with the worst election-eve images of any major-party presidential candidates Gallup has measured back to 1956. Majorities of Americans now view each of them unfavorably on a 10-point favorability scale, a first for any presidential standard-bearer on this long-term Gallup trend. Trump's image is worse than Clinton's, however, with 61% viewing him negatively on the 10-point scale compared with 52% for her.
| Nominee | Total favorable | Total unfavorable | |||||||||||||||||||||||||||||||||||||||||||||||||||||||||||||||||||||||||||||||||||||||||||||||||
|---|---|---|---|---|---|---|---|---|---|---|---|---|---|---|---|---|---|---|---|---|---|---|---|---|---|---|---|---|---|---|---|---|---|---|---|---|---|---|---|---|---|---|---|---|---|---|---|---|---|---|---|---|---|---|---|---|---|---|---|---|---|---|---|---|---|---|---|---|---|---|---|---|---|---|---|---|---|---|---|---|---|---|---|---|---|---|---|---|---|---|---|---|---|---|---|---|---|---|---|
| % (+1 to +5) | % (-1 to -5) | ||||||||||||||||||||||||||||||||||||||||||||||||||||||||||||||||||||||||||||||||||||||||||||||||||
| 2016 Nov 2-5 | D. Trump | 36 | 61 | ||||||||||||||||||||||||||||||||||||||||||||||||||||||||||||||||||||||||||||||||||||||||||||||||
| 2016 Nov 2-5 | H. Clinton | 47 | 52 | ||||||||||||||||||||||||||||||||||||||||||||||||||||||||||||||||||||||||||||||||||||||||||||||||
| 1964 Oct 8-13 | B. Goldwater | 43 | 47 | ||||||||||||||||||||||||||||||||||||||||||||||||||||||||||||||||||||||||||||||||||||||||||||||||
| 2012 Oct 27-28 | M. Romney | 55 | 43 | ||||||||||||||||||||||||||||||||||||||||||||||||||||||||||||||||||||||||||||||||||||||||||||||||
| 1972 Oct 13-16 | G. McGovern | 55 | 41 | ||||||||||||||||||||||||||||||||||||||||||||||||||||||||||||||||||||||||||||||||||||||||||||||||
| 2004 Oct 22-24 | J. Kerry | 57 | 40 | ||||||||||||||||||||||||||||||||||||||||||||||||||||||||||||||||||||||||||||||||||||||||||||||||
| 1992 Oct 23-25 | G.H.W. Bush | 59 | 40 | ||||||||||||||||||||||||||||||||||||||||||||||||||||||||||||||||||||||||||||||||||||||||||||||||
| 2004 Oct 22-24 | G.W. Bush | 61 | 39 | ||||||||||||||||||||||||||||||||||||||||||||||||||||||||||||||||||||||||||||||||||||||||||||||||
| 2012 Oct 27-28 | B. Obama | 62 | 37 | ||||||||||||||||||||||||||||||||||||||||||||||||||||||||||||||||||||||||||||||||||||||||||||||||
| 1980 Oct 10-13 | R. Reagan | 64 | 37 | ||||||||||||||||||||||||||||||||||||||||||||||||||||||||||||||||||||||||||||||||||||||||||||||||
| 2008 Oct 23-26 | B. Obama | 62 | 35 | ||||||||||||||||||||||||||||||||||||||||||||||||||||||||||||||||||||||||||||||||||||||||||||||||
| 2008 Oct 23-26 | J. McCain | 63 | 35 | ||||||||||||||||||||||||||||||||||||||||||||||||||||||||||||||||||||||||||||||||||||||||||||||||
| 1984 Sep 21-24 | W. Mondale | 66 | 34 | ||||||||||||||||||||||||||||||||||||||||||||||||||||||||||||||||||||||||||||||||||||||||||||||||
| 1992 Oct 23-25 | B. Clinton | 64 | 33 | ||||||||||||||||||||||||||||||||||||||||||||||||||||||||||||||||||||||||||||||||||||||||||||||||
| 1980 Oct 10-13 | J. Carter | 68 | 32 | ||||||||||||||||||||||||||||||||||||||||||||||||||||||||||||||||||||||||||||||||||||||||||||||||
| 1956 Oct 18-23 | A. Stevenson | 61 | 31 | ||||||||||||||||||||||||||||||||||||||||||||||||||||||||||||||||||||||||||||||||||||||||||||||||
| 1984 Sep 21-24 | R. Reagan | 71 | 30 | ||||||||||||||||||||||||||||||||||||||||||||||||||||||||||||||||||||||||||||||||||||||||||||||||
| 1968 Oct 17-22 | H. Humphrey | 72 | 28 | ||||||||||||||||||||||||||||||||||||||||||||||||||||||||||||||||||||||||||||||||||||||||||||||||
| 1968 Oct 17-22 | R. Nixon | 79 | 22 | ||||||||||||||||||||||||||||||||||||||||||||||||||||||||||||||||||||||||||||||||||||||||||||||||
| 1972 Oct 13-16 | R. Nixon | 76 | 21 | ||||||||||||||||||||||||||||||||||||||||||||||||||||||||||||||||||||||||||||||||||||||||||||||||
| 1976 Sep 24-27 | G. Ford | 78 | 20 | ||||||||||||||||||||||||||||||||||||||||||||||||||||||||||||||||||||||||||||||||||||||||||||||||
| 1960 Oct 18-23 | R. Nixon | 79 | 16 | ||||||||||||||||||||||||||||||||||||||||||||||||||||||||||||||||||||||||||||||||||||||||||||||||
| 1976 Sep 24-27 | J. Carter | 81 | 16 | ||||||||||||||||||||||||||||||||||||||||||||||||||||||||||||||||||||||||||||||||||||||||||||||||
| 1960 Oct 18-23 | J. Kennedy | 80 | 14 | ||||||||||||||||||||||||||||||||||||||||||||||||||||||||||||||||||||||||||||||||||||||||||||||||
| 1964 Oct 8-13 | L. Johnson | 81 | 13 | ||||||||||||||||||||||||||||||||||||||||||||||||||||||||||||||||||||||||||||||||||||||||||||||||
| 1956 Oct 18-23 | D. Eisenhower | 84 | 12 | ||||||||||||||||||||||||||||||||||||||||||||||||||||||||||||||||||||||||||||||||||||||||||||||||
| No data for 1988, 1996 and 2000 | |||||||||||||||||||||||||||||||||||||||||||||||||||||||||||||||||||||||||||||||||||||||||||||||||||
| Gallup | |||||||||||||||||||||||||||||||||||||||||||||||||||||||||||||||||||||||||||||||||||||||||||||||||||
These findings are based on Gallup's historical "scalometer" favorability measure, which asks respondents for their general opinion of each candidate using a 10-point positive-to-negative scale. Respondents can use any number from +1 to +5 to indicate that they have a favorable view of a candidate, with +5 being highly favorable. They can use any number from -1 to -5 for an unfavorable view, with -5 being highly unfavorable. The latest survey was conducted by telephone Nov. 2-5 with a nationwide sample of U.S. adults.
The scalometer measure tends to produce higher positive ratings than the binary favorable/unfavorable choice that has been the mainstay of Gallup's favorability measurement since 1992, although that is currently more true for Clinton than for Trump. Clinton's straight-up "favorable" rating is 40% in Gallup Daily tracking for the week ending Nov. 6, while Trump's is 35%.
2016 Campaign Sets Record-High Unfavorability Scores
The extent of Americans' distaste for the two major-party candidates is further evident in the extraordinarily high percentages viewing each highly unfavorably -- rating them a -5 or -4 on the scale. Forty-two percent of Americans view Trump highly unfavorably, unchanged from Gallup's prior measure in June. Clinton's highly unfavorable rating is nearly as high, at 39%, but up from 33% in June.
Both candidates' highly unfavorable ratings far outpace any Gallup has recorded before for a major-party presidential nominee, with the next-highest being Republican Barry Goldwater's 26% score in 1964. Even the former Alabama governor and proponent of racial segregation, George Wallace, who ran for president as a third-party candidate in 1968, earned a lower high unfavorability score that year (32%) than the 2016 candidates do today.
| Nominee | Highly favorable | Highly unfavorable | |||||||||||||||||||||||||||||||||||||||||||||||||||||||||||||||||||||||||||||||||||||||||||||||||
|---|---|---|---|---|---|---|---|---|---|---|---|---|---|---|---|---|---|---|---|---|---|---|---|---|---|---|---|---|---|---|---|---|---|---|---|---|---|---|---|---|---|---|---|---|---|---|---|---|---|---|---|---|---|---|---|---|---|---|---|---|---|---|---|---|---|---|---|---|---|---|---|---|---|---|---|---|---|---|---|---|---|---|---|---|---|---|---|---|---|---|---|---|---|---|---|---|---|---|---|
| % (+4 to +5) | % (-4 to -5) | ||||||||||||||||||||||||||||||||||||||||||||||||||||||||||||||||||||||||||||||||||||||||||||||||||
| 2016 Nov 2-5 | D. Trump | 14 | 42 | ||||||||||||||||||||||||||||||||||||||||||||||||||||||||||||||||||||||||||||||||||||||||||||||||
| 2016 Nov 2-5 | H. Clinton | 21 | 39 | ||||||||||||||||||||||||||||||||||||||||||||||||||||||||||||||||||||||||||||||||||||||||||||||||
| 1964 Oct 8-13 | B. Goldwater | 17 | 26 | ||||||||||||||||||||||||||||||||||||||||||||||||||||||||||||||||||||||||||||||||||||||||||||||||
| 2012 Oct 27-28 | B. Obama | 36 | 24 | ||||||||||||||||||||||||||||||||||||||||||||||||||||||||||||||||||||||||||||||||||||||||||||||||
| 2004 Oct 22-24 | G.W. Bush | 34 | 23 | ||||||||||||||||||||||||||||||||||||||||||||||||||||||||||||||||||||||||||||||||||||||||||||||||
| 2004 Oct 22-24 | J. Kerry | 22 | 22 | ||||||||||||||||||||||||||||||||||||||||||||||||||||||||||||||||||||||||||||||||||||||||||||||||
| 2012 Oct 27-28 | M. Romney | 30 | 22 | ||||||||||||||||||||||||||||||||||||||||||||||||||||||||||||||||||||||||||||||||||||||||||||||||
| 2008 Oct 23-26 | B. Obama | 37 | 22 | ||||||||||||||||||||||||||||||||||||||||||||||||||||||||||||||||||||||||||||||||||||||||||||||||
| 1972 Oct 13-16 | G. McGovern | 21 | 20 | ||||||||||||||||||||||||||||||||||||||||||||||||||||||||||||||||||||||||||||||||||||||||||||||||
| 2008 Oct 23-26 | J. McCain | 28 | 20 | ||||||||||||||||||||||||||||||||||||||||||||||||||||||||||||||||||||||||||||||||||||||||||||||||
| 1984 Sep 21-24 | R. Reagan | 43 | 18 | ||||||||||||||||||||||||||||||||||||||||||||||||||||||||||||||||||||||||||||||||||||||||||||||||
| 1980 Oct 10-13 | J. Carter | 31 | 17 | ||||||||||||||||||||||||||||||||||||||||||||||||||||||||||||||||||||||||||||||||||||||||||||||||
| 1992 Oct 23-25 | G.H.W. Bush | 20 | 16 | ||||||||||||||||||||||||||||||||||||||||||||||||||||||||||||||||||||||||||||||||||||||||||||||||
| 1980 Oct 10-13 | R. Reagan | 26 | 16 | ||||||||||||||||||||||||||||||||||||||||||||||||||||||||||||||||||||||||||||||||||||||||||||||||
| 1956 Oct 18-23 | A. Stevenson | 34 | 16 | ||||||||||||||||||||||||||||||||||||||||||||||||||||||||||||||||||||||||||||||||||||||||||||||||
| 1992 Oct 23-25 | B. Clinton | 27 | 15 | ||||||||||||||||||||||||||||||||||||||||||||||||||||||||||||||||||||||||||||||||||||||||||||||||
| 1984 Sep 21-24 | W. Mondale | 28 | 15 | ||||||||||||||||||||||||||||||||||||||||||||||||||||||||||||||||||||||||||||||||||||||||||||||||
| 1968 Oct 17-22 | H. Humphrey | 29 | 11 | ||||||||||||||||||||||||||||||||||||||||||||||||||||||||||||||||||||||||||||||||||||||||||||||||
| 1972 Oct 13-16 | R. Nixon | 41 | 11 | ||||||||||||||||||||||||||||||||||||||||||||||||||||||||||||||||||||||||||||||||||||||||||||||||
| 1976 Sep 24-27 | G. Ford | 29 | 9 | ||||||||||||||||||||||||||||||||||||||||||||||||||||||||||||||||||||||||||||||||||||||||||||||||
| 1968 Oct 17-22 | R. Nixon | 39 | 8 | ||||||||||||||||||||||||||||||||||||||||||||||||||||||||||||||||||||||||||||||||||||||||||||||||
| 1960 Oct 18-23 | R. Nixon | 37 | 5 | ||||||||||||||||||||||||||||||||||||||||||||||||||||||||||||||||||||||||||||||||||||||||||||||||
| 1976 Sep 24-27 | J. Carter | 42 | 5 | ||||||||||||||||||||||||||||||||||||||||||||||||||||||||||||||||||||||||||||||||||||||||||||||||
| 1960 Oct 18-23 | J. Kennedy | 43 | 5 | ||||||||||||||||||||||||||||||||||||||||||||||||||||||||||||||||||||||||||||||||||||||||||||||||
| 1964 Oct 8-13 | L. Johnson | 49 | 5 | ||||||||||||||||||||||||||||||||||||||||||||||||||||||||||||||||||||||||||||||||||||||||||||||||
| 1956 Oct 18-23 | D. Eisenhower | 57 | 4 | ||||||||||||||||||||||||||||||||||||||||||||||||||||||||||||||||||||||||||||||||||||||||||||||||
| Dates for all years are final pre-election; no data for 1988, 1996 and 2000 | |||||||||||||||||||||||||||||||||||||||||||||||||||||||||||||||||||||||||||||||||||||||||||||||||||
| Gallup | |||||||||||||||||||||||||||||||||||||||||||||||||||||||||||||||||||||||||||||||||||||||||||||||||||
Bottom Line
Americans' fundamental reactions to their 2016 presidential candidates are at least as negative today as when Clinton and Trump emerged as their respective parties' presumptive nominees in June. The subsequent ups and downs of the campaign have resulted in no meaningful change to Trump's image, and have had a modest negative effect on Clinton's, with her highly unfavorable rating inching up to match Trump's.
The 2016 election is the only one in Gallup's polling history to feature two broadly unpopular candidates. Further, when factoring in the high percentages viewing each very negatively, Trump and Clinton are the two most negatively reviewed U.S. presidential candidates of the modern era, and probably ever.
There has been a trend toward harsher ratings of candidates in recent elections. Indeed, as Gallup noted in June, no presidential candidate since Ronald Reagan in 1984 has ended a campaign with a total favorable scalometer score above 70%. But even in the last two elections, all candidates enjoyed total favorable scores of 55% or higher, far better than either candidate today.
In sum, this contest of historically unpopular candidates concludes with Clinton the apparent "lesser of two evils," and that could be what decides the election.
Historical data are available in Gallup Analytics.
Survey Methods
Results for this Gallup poll are based on telephone interviews conducted Nov. 2-5, 2016, on the Gallup U.S. Daily survey, with a random sample of 1,033 adults, aged 18 and older, living in all 50 U.S. states and the District of Columbia. For results based on the total sample of national adults, the margin of sampling error is ±4 percentage points at the 95% confidence level. For results based on the total sample of 947 registered voters, the margin of sampling error is ±4 percentage points at the 95% confidence level. All reported margins of sampling error include computed design effects for weighting.
Each sample of national adults includes a minimum quota of 60% cellphone respondents and 40% landline respondents, with additional minimum quotas by time zone within region. Landline and cellular telephone numbers are selected using random-digit-dial methods.
View complete question responses and trends (PDF download).
Learn more about how the Gallup U.S. Daily works.