GALLUP NEWS SERVICE
PRINCETON, NJ -- There's been a significant shift in public opinion on gay and lesbian rights over the last two months. Two polls conducted in July, after the Supreme Court's June 26 decision to overturn a Texas anti-sodomy law, showed a significant drop in the percentage of Americans supporting legalized homosexual relations. The latest Gallup Poll also shows that Americans are now less likely than they were in May to consider gay relationships acceptable, and also less likely to favor a law that would legalize homosexual civil unions. In fact, support for legalized civil unions has dropped to its lowest point of the four years in which Gallup polls have asked about it.
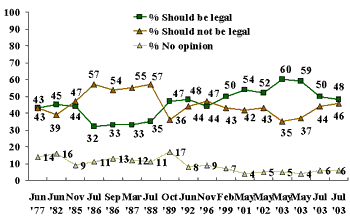
Support for Legalizing Homosexual Relations Drops
Americans' acceptance of the concept that "homosexual relations between consenting adults" should be legal had -- up until this month -- slowly increased, from a low point of 32% recorded in 1986 to the high point of 60% this May. But two separate Gallup polls conducted this month show a dramatic reversal of this trend. A July 18-20 poll found 50% of Americans saying that homosexual relations should be legal, and a just completed July 25-27 poll confirms the substantial drop in support, with just 48% of those interviewed saying such relations should be legal. Thus, the level of support for legal homosexual relations has dropped 10-12 points in a period of just two months.
| Do you think homosexual relations between consenting adults should or should not be legal? |
 |
Acceptable Lifestyle?
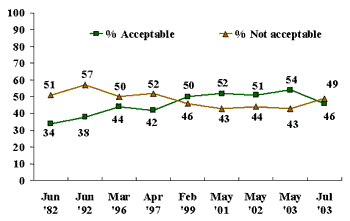
Declining support for acceptance of homosexuality appears in the responses to several other questions asked in May and again in the most recent July poll. While 54% of Americans said that "homosexuality should be considered an acceptable lifestyle" in May, only 46% say so now.
| Do you feel that homosexuality should be considered an acceptable alternative lifestyle or not? |
 |
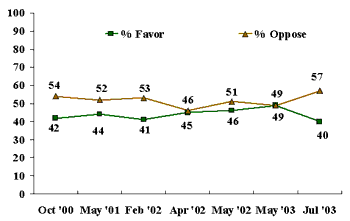
Support for allowing homosexual couples to "legally form civil unions, giving them some of the legal rights of married couples" has fallen from 49% in May to 40% now. The current reading on this measure is the lowest out of the seven times Gallup has asked the question since October 2000.
| Would you favor or oppose a law that would allow homosexual couples to legally form civil unions, giving them some of the legal rights of married couples? |
 |
Impact of Supreme Court Decision
Why has support for gay rights dropped so significantly in the space of just two months? There is no way of ascertaining the answer to this question directly, but it is clear that the major intervening gay rights issue occurring between the May poll and the current one was the June 26 Supreme Court decision that struck down an anti-sodomy law in Texas that had banned sex between two consenting adults of the same gender. Thus, it is reasonable to hypothesize that the court decision, coupled with highly publicized discussions of the ruling's potential impact, may have been a major factor in the shift in the public's attitudes.
At the time of the decision, gay rights leaders hailed the ruling as a landmark milestone in their quest for full acceptance in American society. The Human Rights Campaign, a prominent organization working for lesbian, gay, bisexual and transgender equal rights, lauded the ruling, and its Executive Director, Elizabeth Birch, said in a press release, "This is an historic day for fair-minded Americans everywhere. We are elated and gratified that the Supreme Court, in its wisdom, has seen discriminatory state sodomy laws for what they are — divisive, mean spirited laws that were designed to single out and marginalize an entire group of Americans for unequal treatment."
But the new polling data suggest a backlash. The discussion that followed the Supreme Court decision focused in part on whether it would increase the possibility of legalized gay marriage and other, more formal, reductions of the distinction between heterosexual and homosexual relations in society. Indeed, there was news on Tuesday of the formation of the first public high school for gay, bisexual and transgender students in the New York City School District, with the observation by some that the school probably would not have been developed without the Supreme Court decision. Religious conservatives such as Pat Robertson have also weighed in with their criticism of the court on its decision.
Thus, it may be that Americans -- formerly willing to accept the concept of gay rights -- have been pushed to more conservative positions by the intense focus on the potential for dramatic future change in American society. Or it could be that the intense and vocal opposition to the liberalization of gay rights that surfaced after the decision has activated what had been more dormant conservative attitudes within the American population.
Who Has Shifted the Most?
The table below displays a comparison between the percentage of Americans favoring the legalization of homosexual relations between consenting adults in the combined sample of 2,019 people in May with the combined sample of 2,009 people interviewed in July, and between various subgroups of the population at both points in time. There is movement away from a more tolerant view of homosexuality evident in most major subgroups:
|
Support for Legalized Homosexual Relations May and July 2003 |
|||||
|
May 2003 Should be legal |
N = |
July 2003 Should be legal |
N = |
Difference (July-May LEGAL) |
|
|
% |
% |
Pct. Pts. |
|||
|
Total |
59 |
2019 |
49 |
2009 |
-10 |
|
Men |
58 |
967 |
45 |
965 |
-13 |
|
Women |
61 |
1050 |
50 |
1045 |
-11 |
|
Attend church once a week |
40 |
330 |
27 |
578 |
-13 |
|
Almost every week |
61 |
132 |
43 |
250 |
-18 |
|
Once a month |
59 |
141 |
49 |
255 |
-10 |
|
Seldom |
74 |
276 |
65 |
538 |
-9 |
|
Never |
80 |
121 |
67 |
359 |
-13 |
|
Only asked in the May 5-7, 2003 poll for May aggregate |
|||||
|
East |
65 |
461 |
53 |
457 |
-12 |
|
Midwest |
58 |
472 |
45 |
472 |
-13 |
|
South |
50 |
648 |
42 |
645 |
-8 |
|
West |
69 |
437 |
59 |
437 |
-10 |
|
High school education or less |
50 |
838 |
38 |
819 |
-12 |
|
Some college |
63 |
624 |
49 |
649 |
-14 |
|
College graduate |
69 |
281 |
60 |
271 |
-9 |
|
Post-graduate |
71 |
270 |
73 |
262 |
2 |
|
Republican |
51 |
652 |
38 |
661 |
-13 |
|
Independent |
64 |
706 |
58 |
712 |
-6 |
|
Democrat |
63 |
635 |
51 |
632 |
-12 |
|
18-29 year olds |
69 |
381 |
60 |
381 |
-9 |
|
30-49 year olds |
65 |
824 |
52 |
814 |
-13 |
|
50-64 year olds |
57 |
452 |
46 |
457 |
-11 |
|
65 years and older |
39 |
333 |
35 |
333 |
-4 |
|
Less than $20,000 per year |
46 |
288 |
39 |
306 |
-7 |
|
$20-29,999 |
58 |
306 |
44 |
229 |
-14 |
|
$30-49,999 |
62 |
499 |
51 |
532 |
-11 |
|
$50-74,999 |
61 |
382 |
48 |
382 |
-13 |
|
$75,000 and more |
71 |
441 |
61 |
445 |
-10 |
|
Conservative |
46 |
790 |
33 |
785 |
-13 |
|
Moderate |
64 |
780 |
56 |
777 |
-8 |
|
Liberal |
75 |
429 |
67 |
421 |
-8 |
|
Whites |
59 |
1575 |
50 |
1574 |
-9 |
|
Blacks |
58 |
214 |
35 |
211 |
-23 |
The same basic patterns exist in both samples: (1) young Americans are more tolerant that older Americans, (2) those who are liberal and moderate are more tolerant than those who are conservative, (3) Democrats and independents are more tolerant than Republicans, (4) those with higher levels of education are more tolerant than those with less education, and (5) those who don't attend church frequently are more tolerant than frequent church attendees.
On the other hand, the most pronounced pattern of change is among blacks. In May, blacks and whites were essentially identical in the levels of support they expressed for legalized gay relations. In July, the percentage of blacks supporting legal gay relations dropped by 23 points, compared to a much more modest 9 point drop among whites.
Previous Gallup research has documented the fact that blacks are quite conservative on moral issues, even while adopting more liberal positions on social issues such as gun control, the death penalty, and welfare. This fact is often surprising to some observers, given the strong tendencies for blacks to identify with the more liberal Democratic Party in this country. The conservative moral positions adopted by blacks no doubt reflect the strong influence of religion in black culture in American society today.
Still, it is not immediately clear why support among blacks may have fallen so disproportionately in July. One can hypothesize that the Supreme Court decision had a greater effect on black's religiosity than others', but it is difficult to document this assertion based on available data.
Other patterns include the following:
- Acceptance of legalized homosexuality fell slightly more among conservatives (13 percentage points) than it did for moderates or liberals (8 percentage points each) over the two-month period.
- The decrease in acceptance of homosexuality is slightly higher among 30-64 year olds. The aggregate shows roughly a 12 percentage point drop among people in this age group, compared with a 9 point drop among 18-29 year olds and only a 4 point drop among people aged 65 and older.
- Support among less well-educated Americans fell more than it did among Americans with higher levels of education.
Survey Methods
The latest results are based on telephone interviews with 1006 national adults, aged 18+, conducted July 25-27, 2003. For results based on the total sample of national adults, one can say with 95% confidence that the maximum margin of sampling error is ±3 percentage points.